
FIGURE 4.
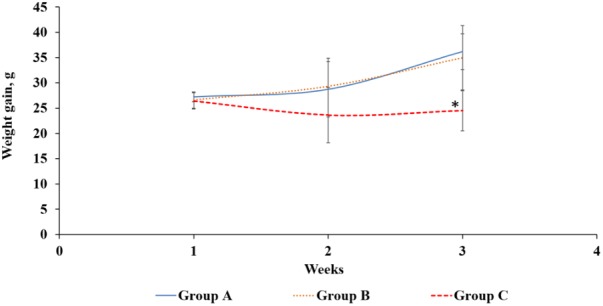
Body weight gain (g) of rats from three different groups throughout the treatment periods. Group A: control, oral gavaged with PBS only; Group B: oral gavaged with both Lcs and AFB1; Group C: oral gavaged with AFB1 only. Data are means from eight rats for each group (error bars indicate mean ± SD). An asterisk (∗) indicates a significant difference to group A and group B with p < 0.05.