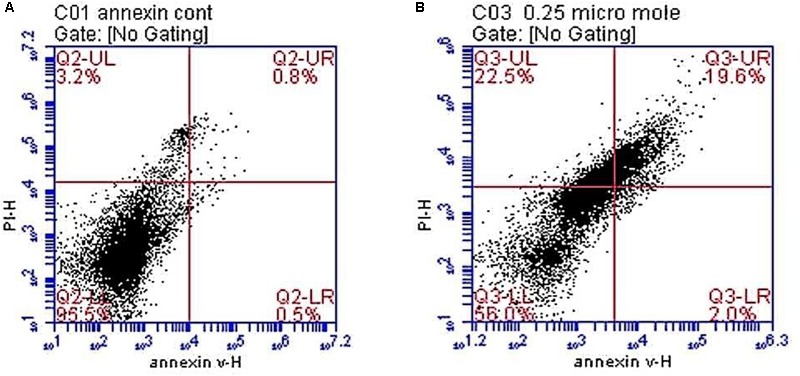
FIGURE 3.

Histograms showing flowcytometric analysis of the neuronal cell cultures in control and test groups. (A) A histogram showing that most of the neurospheres are viable in the control group. (B) A histogram showing decreased cellular viability, increased necrosis, early and late apoptosis in neurospheres exposed to trichloroethylene (TCE) 0.25 μM [viable cells in the lower left quadrant (LL), early apoptotic cells in the lower right (LR) quadrant, late apoptosis is seen in the upper right (UR) while necrosis is shown in the upper left (UL) quadrants].
