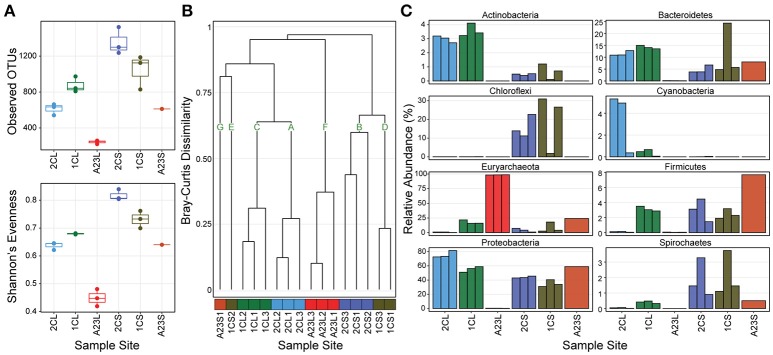
Figure 1.
OTU abundance, diversity, and phyla of sampled ponds. Pond sample types are denoted with an “L” or “S” for water or sediment. (A) Richness and Evenness metrics for triplicates at each sample site (Pond A23 sediments has only a single replicate) (B) Bray-Curtis Dissimilarity dendrogram of all sample sites, color coded by sampled pond with assignment into seven groups at a cut-off of 0.6. (C) Relative abundance of the 8 most abundant phyla grouped by sample site.

