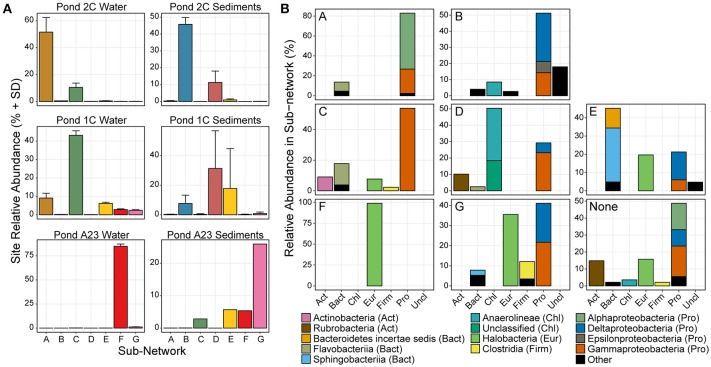
Figure 2.
Relative abundance and phyla classification of seven main sub-networks. (A) The average relative abundance and standard deviation of OTUs in each of the 7 sub-networks show that certain microbial groups cluster strongly with a certain salinity or sample type. Only OTUs in the major sub-networks are shown. (B) Phylum distribution of OTUs in the 7 major sub-networks, colored by taxonomic class.

