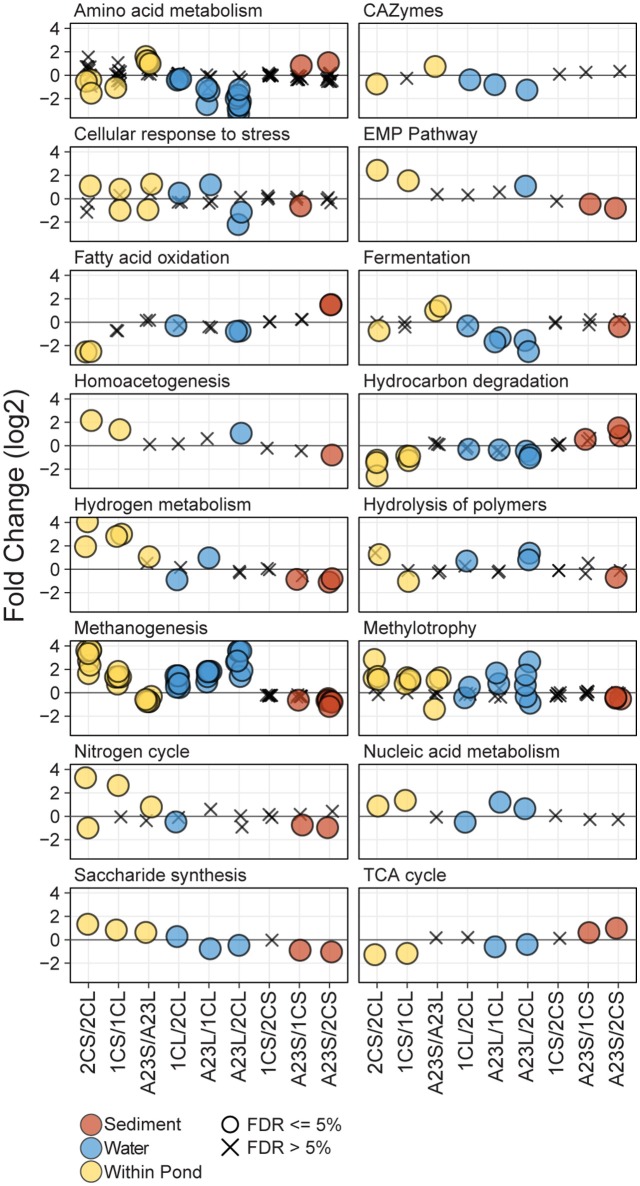
Figure 3.
Differential abundance of FOAM L1 and L2 categories. Differential abundance of FOAM categories between different comparisons of the metagenomic data. For each comparison, negative numbers are higher in abundance for the sample listed first, and positive numbers are higher for the sample listed second. Points are represented as circles if significantly different (FDR ≤ 5%) and Xs if not significant. Each panel represents a FOAM L1 category, and each circle represents a FOAM L2 category. Comparisons include between water and sediment triplicates of a pond (yellow), between water samples from different ponds (blue) and between sediment samples from different ponds (brown). Comparisons are arranged from left to right with increasing salinity or increasing salinity differences.

