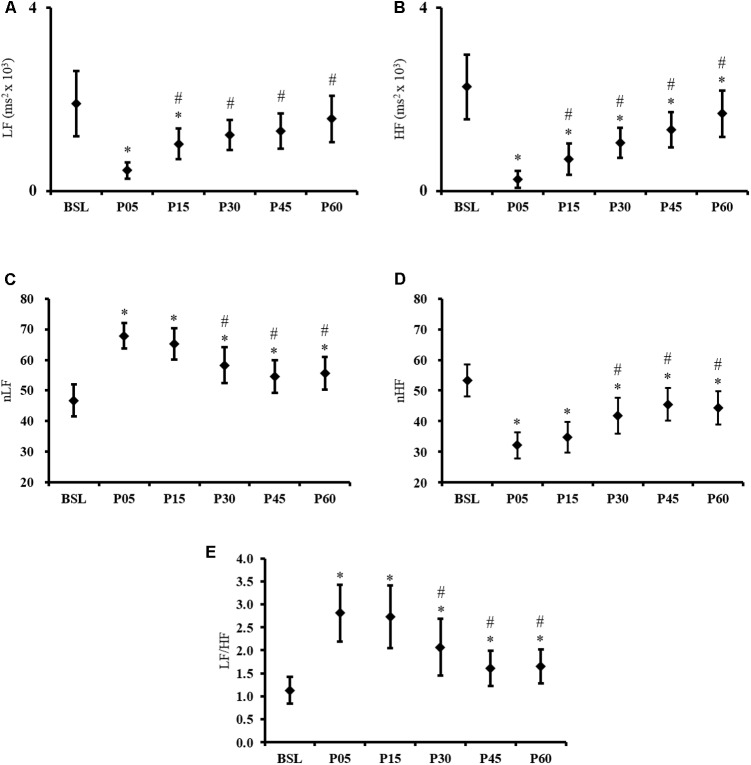
FIGURE 2.
Frequency domain HRV results. Time course of (A) LF, (B) HF, (C) nLF, (D) nHF, and (E) LF/HF ratio, recorded at baseline (BSL) and 5 (P05), 15 (P15), 30 (P30), 45 (P45), and 60 (P60) minutes after exercise cessation. Error bars indicate the 95% confidence interval. ∗Indicates a significant difference from BSL. #Indicates a significant difference from P05; p-value < 0.05.

