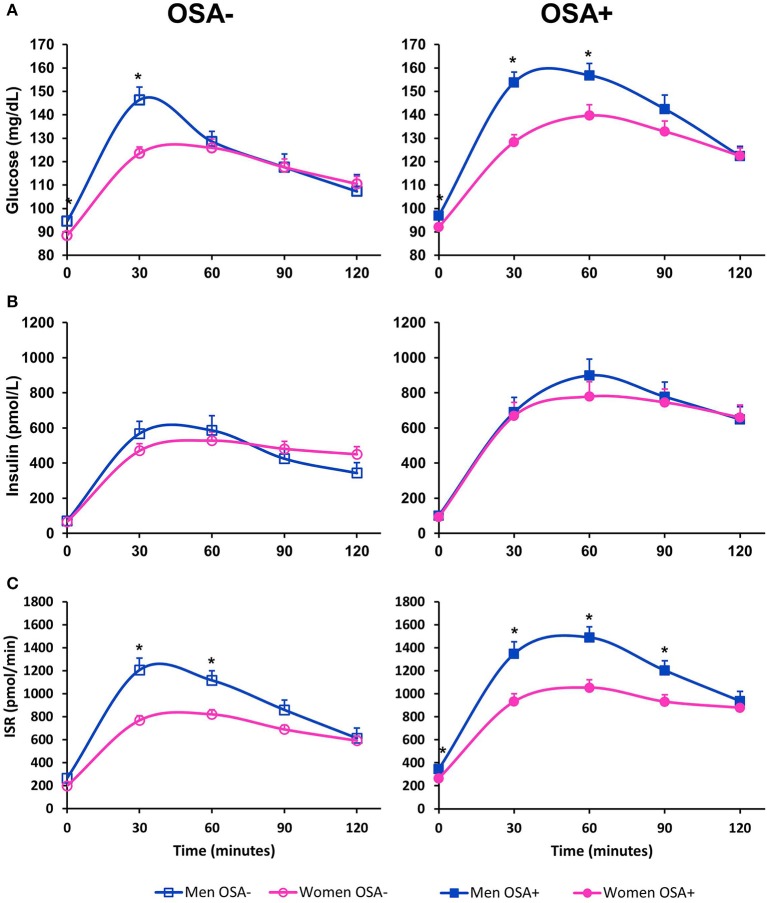
Figure 1.
Oral glucose tolerance test in men and women with and without OSA. (A) Illustrates plasma glucose, (B) illustrates serum insulin and (C) illustrates insulin secretion rate (ISR) as measured during a 2-h 75-g oral glucose challenge. Data are represented as mean + SEM. *denotes an unadjusted p-value < 0.05 from a student's t-test for variables with normal distribution, and Wilcoxon test for variables that are not normally distributed.

