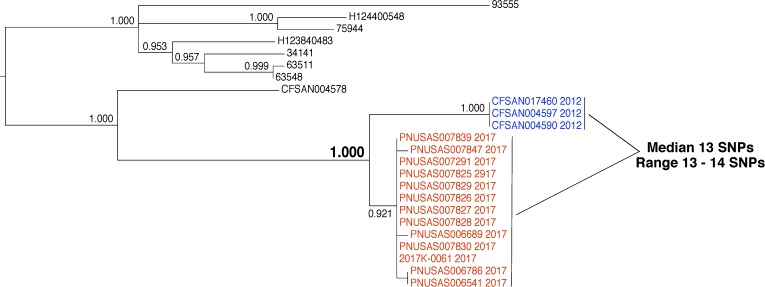
FIGURE 8.
Phylogenetic analysis of genome sequences obtained from Salmonella enterica isolates collected from a food processing facility and closely related clinical isolates. A SNP matrix was generated for 24 isolates with the CFSAN SNP pipeline v0.8.0 (Davis et al., 2015). The SNP matrix was phylogenetically analyzed with GARLI v2.01.1067 (Zwicki, 2006), using the K80 and HKY nucleotide substitution models. Branch labels indicate support values for 1000 bootstrap replicates. Bootstrap values less than 0.800 are not shown. Blue labels indicate environmental isolates and red labels indicate clinical isolates. Black labels indicate isolates that are not the focus of this example but are closely related.

