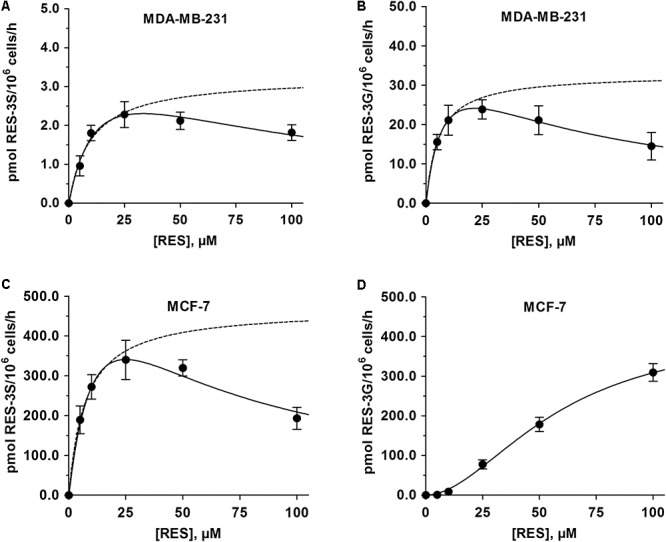
FIGURE 2.

Kinetic profiles for the formation of 3-O-conjugated RES-metabolites by MDA-MB-231 and MCF-7 cells. The formation of (A) RES-3S and (B) RES-3G by MDA-MB-231 cells was determined following incubation with 0–100 μM RES for 48 h, and modeled using the substrate inhibition model. The formation of (C) RES-3S and (D) RES-3G by MCF-7 cells were evaluated with the same protocol. While the formation of RES-3S correlated with the substrate inhibition model, the formation of RES-3S was best described by the sigmoidal Hill model. Dashed lines represent the kinetic profiles without substrate inhibition. All data represent the means ± SD of three independent biological replicates.
