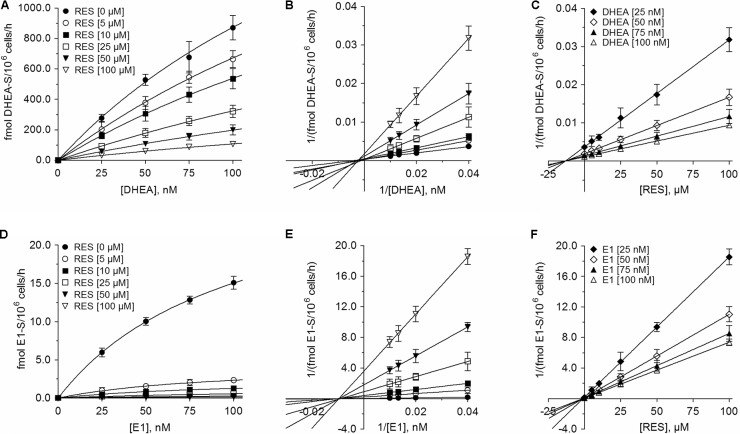
FIGURE 6.
Kinetic profiles of the inhibition of DHEA sulfation and E1 sulfation in MCF-7 cells by RES. The kinetics of (A–C) DHEA sulfation and (D–F) E1 sulfation were calculated following the incubation of MCF-7 cells with 0–100 nM DHEA or E1 as hormone precursors in the absence or presence of 0–100 μM RES for 48 h. Data are displayed as Michaelis–Menten, Lineweaver–Burk, and Dixon plots. All data represent the means ± SD of three independent biological replicates.

