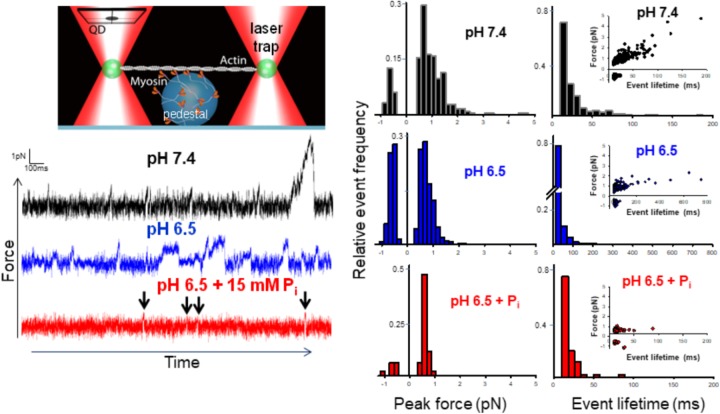
FIGURE 1.
Effect of acidosis and phosphate on myosin’s force-generating capacity. Schematic of the mini-ensemble of myosin molecules in a laser trap assay (on large sphere), showing a single actin filament pulled taut between two optically trapped 1 um silica beads, top left. Raw displacement vs. time records with actomyosin binding events appearing as reductions in the variance and displacements from the mean signal under each condition indicated (see section “Methods”). Determination of the stiffness of the laser trap (0.02 pN/nm) enabled converting these displacements into forces. An automated routine written MatLab was used to determine the peak force for each event (see section “Methods” and Supplementary Materials). Scored events were used to construct histograms and plotted as a function of the total number of events in a condition (middle set of panels). Then median forces were 0.78 ± 0.27 (pH 7.4, black), 0.63 ± 0.13 (pH 6.5, blue)∗, and 0.59 ± 0.06 pN (pH 6.5 + 15 mM Pi, red)∗ for control, acidosis, and acidosis with added Pi respectively, ∗indicates significantly (p < 0.05) lower than control. The lifetime of each event was also determined using the same automated routine (see section “Methods” and Supplementary Materials) and histograms constructed for each condition (right panels). Insets show peak force plotted as a function of event lifetime. Median event lifetimes were 18 ± 1, 15 ± 1∗, and 15 ± 0.5∗ ms for control (black), acidosis (blue), and acidosis + Pi respectively (red) (∗indicates significantly different from control, p < 0.05). The data shown represent between 329, 623, and 87 binding events for control, acidosis, and acidosis + Pi respectively.

