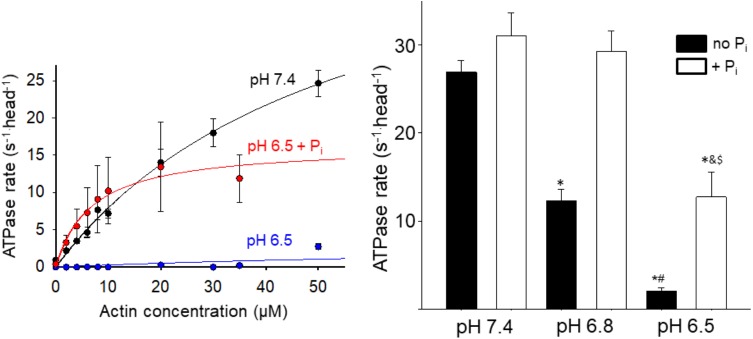
FIGURE 2.
Effect of acidosis and phosphate on steady state ATPase. The rate of product release from HMM as a function of actin concentration was determined using an NADH-linked assay (left graph, see Supplementary Materials for details), under control (pH 7.4 no added Pi), acidic (pH 6.5), and acidic plus Pi (pH 6.5 + 10 mM Pi) conditions. Each point represents the mean ± SEM between 7 and 33 measures at each actin concentration. The maximum rates obtained under each condition (including pH 6.8 and pH 6.8 + Pi) are plotted in the graph on the right side. Bars represent mean ± SEM for the concentration of actin yielding the highest rate. ∗Indicates significantly (p < 0.05) different from control, #indicates significantly different from pH 6.8 no Pi, &indicates significantly different from pH 6.5 no Pi, and $indicates significantly different from pH 6.8 + Pi.

