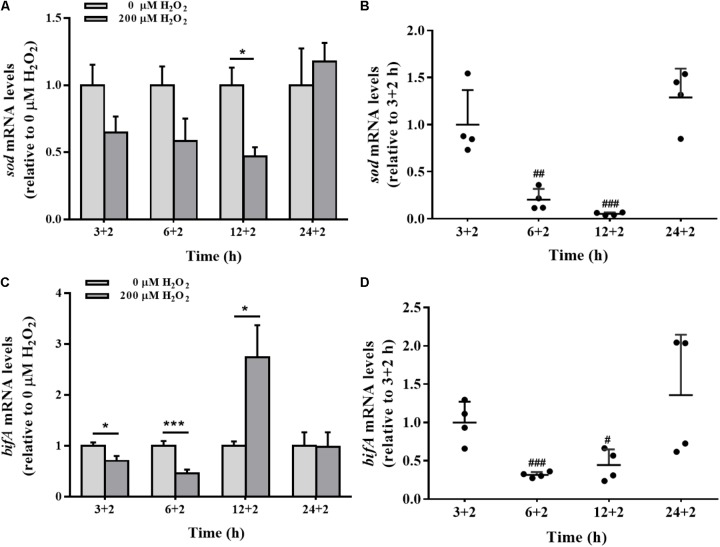
FIGURE 6.
The sod and bifA mRNA levels in biofilm cells as well as during biofilm development with exogenous H2O2. sod (A) and bifA (C) mRNA levels were detected by qRT-PCR analysis in colonized cells incubated with 200 μM H2O2 for 2 h after 3 h, 6, 12, and 24 h cultivation for adhesion, respectively. Relative gene expression levels of sod and bifA were normalized to 16s rRNA (n = 4), respectively. The cellular mRNA levels of sod (B) and bifA (D) during different stages of biofilm formation. Data were expressed as mean ± SEM. Significance, ∗P < 0.05, ∗∗P < 0.01, and ∗∗∗P < 0.001 vs. control group (0 μM H2O2). #P < 0.05, ##P < 0.01, and ###P < 0.001 vs. 3 h-biofilm formation group.

