Figure 7.
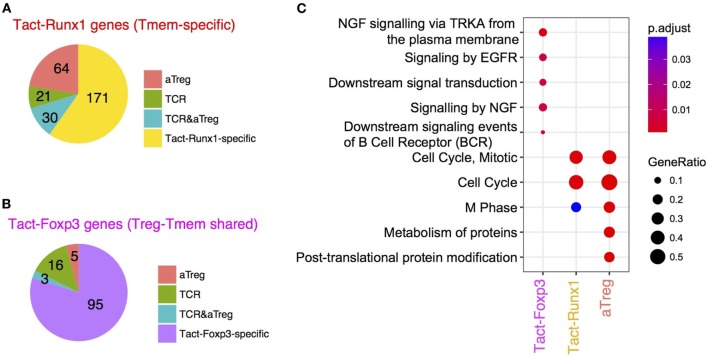
The comparative analysis of Tmem-specific and Treg-Tmem shared activation genes and T cell receptor (TCR)-dependent and activated Treg (aTreg)-specific genes. Venn diagram analysis was used to obtain intersects of TCR-dependent genes (DEG between Tcra KO and WT Treg), aTreg-specific genes (DEG between aTreg and resting Treg), and Tact-Foxp3 and Tact-Runx1 genes (see Figure 4). (A) Pie chart showing the number of genes in the intersects between aTreg-specific genes, TCR-dependent genes, and Tact-Runx1 genes. (B) Pie chart showing the number of genes in the intersects between aTreg-specific genes, TCR-dependent genes, and Tact-Foxp3 genes. (C) Pathway analysis of Tact-Foxp3 genes, Tact-Runx1 genes, and aTreg-specific genes showing enriched pathways in these gene lists.

