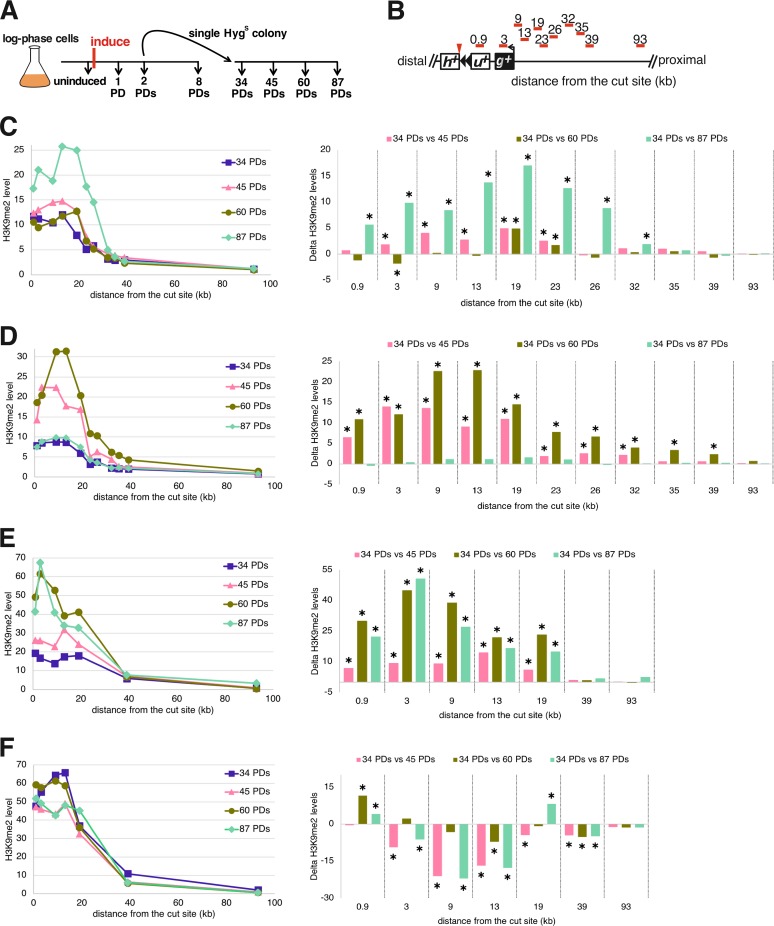
FIG 12.
The H3K9me2 domain remains dynamic as the new telomere reaches its equilibrium length. (A) Telomere formation was induced, and samples were taken at different time points for analysis of telomere lengths and H3K9me2 levels. (B) The primer sets used to monitor the levels of histone H3K9me2 enrichment at several loci are shown as red bars. Distances are relative to the I-SceI cut site, represented as a red arrowhead. The 0.9- and 3-kb probes are in ura4+ (u+) and gal1+ (g+), respectively; h+, hph+. (C to F) (Right) Four independent kinetic analyses of heterochromatin spreading of a single hygromycin-sensitive colony (A), derived from PD 2 of the time courses shown in Fig. 11. (Left) Statistical comparisons of ChIP time courses of H3K9me2 spreading compared to 34-PD H3K9me2 levels. Statistically significant differences (P < 0.05; t test) are indicated by asterisks, as in Fig. 11.

