FIG 3.
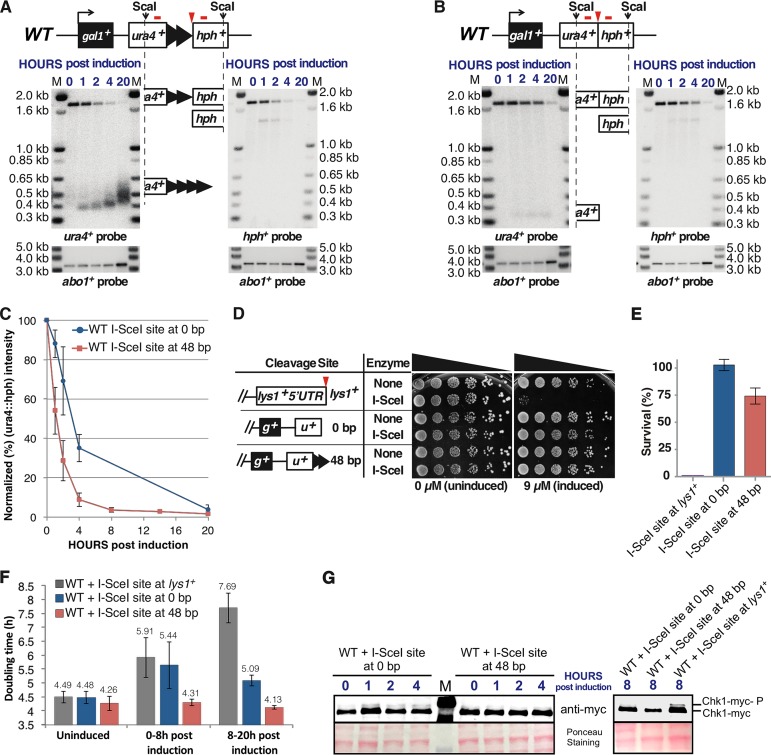
I-SceI cleavage converts the 48-bp prototelomere to a telomere. (A) Exponentially growing cells bearing the 48-bp prototelomere and the I-SceI expression cassette were treated with ahTET (9 μM final concentration), and aliquots were taken either prior to induction (0 h) or after induction (1 to 20 h). WT signifies the wild-type genomic background for the telomere formation strains (e.g., YJRE210 [Table 1]). Genomic DNA was digested with ScaI and analyzed by Southern analysis using probes for ura4+ or hph+ (denoted by red bars above each locus). The I-SceI site is marked by a red triangle. The prototelomere fragment is rapidly converted to the smaller ura4+ and hph+ fragments. The I-SceI-cleaved ScaI-ura4+ and hph+-ScaI bands are indicated by partial ideograms of the original diagram of the prototelomere. The numbers in blue above the blot represent the hours postinduction. As a control for loading, the blots were rehybridized with an abo1+ probe, shown below the Southern blot. Molecular size standards are shown (lanes M). (B) Cells bearing the 0-bp prototelomere cassette were treated and analyzed as for panel A. (C) Normalized intensities of the 1.8-kb uncut ura4+::hph+ band from cells bearing the I-SceI expression cassette and the 48-bp prototelomere or the 0-bp prototelomere. Normalization was the average of the Typhoon Imager signal for either ura4+ or hph+ divided by the abo1+ signal for the respective lane. The error bars show SEM from triplicate assays. (D) Serial 5-fold dilutions of cells bearing an I-SceI site at lys1+ and the 48- and 0-bp prototelomere cassettes were spotted onto minimal medium that lacked or had ahTET (9 μM). The diagrams show one side of each cleavage site (g+, gal1+; u+, ura4+). (E) Quantitation of survival of the strains shown in panel D after induction of I-SceI. Survival of both the 0-bp and 48-bp prototelomere strains was significantly different than that of the strain bearing the I-SceI site at lys1+ (P < 0.01; t test). The 0-bp and 48-bp strains were not significantly different (P = 0.09; t test). The error bars show SEM from duplicate assays. (F) Doubling times of 3 independently induced cultures obtained by determining cell concentration using a hemocytometer. More than 1,000 cells were counted for each genetic construction (the I-SceI expression cassette with an I-SceI site at lys1+ or at the 0-bp or 48-bp prototelomere). The doubling times prior to induction (uninduced), 0 to 8 h postinduction, and 8 to 20 h postinduction are shown above the bars. The error bars show standard deviations from 3 independent assays. (G) Western analysis of Chk1-myc in cells bearing the I-SceI expression cassette and the I-SceI site at lys1+ or the 48-bp and 0-bp prototelomere cassettes. Cell samples were taken prior to induction (0 h) or after the addition of ahTET to 9 μM (1 to 8 h). Whole-cell extracts were then analyzed by Western blotting with an antibody directed against the myc epitope tag at the C terminus of Chk1. The 0.1% Ponceau S (5% acetic acid) staining of the membrane shows the relative amounts of protein loaded.

