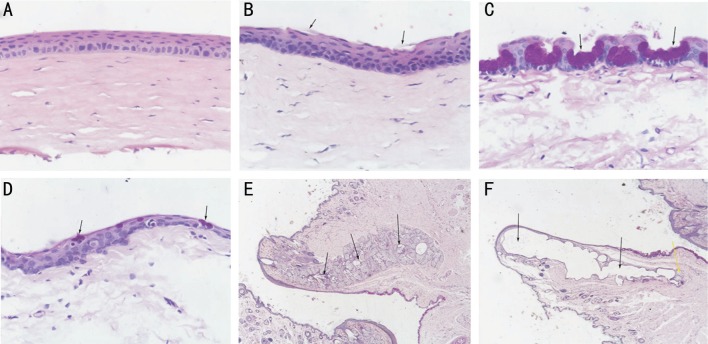
Figure 5. H&E and PAS staining.
A: Epithelium was intact in the control group (×200); B: Black arrows show the epithelium was detached in the model group (×200); C: Black arrows show the conjunctival goblet cells in the control group (×200); D: Black arrows show the conjunctival goblet cells were significantly fewer than in the control group (×200); E: Black arrows show normal gland tissues (×20); F: Black arrows show that the meibomian glands were mostly destroyed. The yellow arrow shows residual gland tissues (×20).

