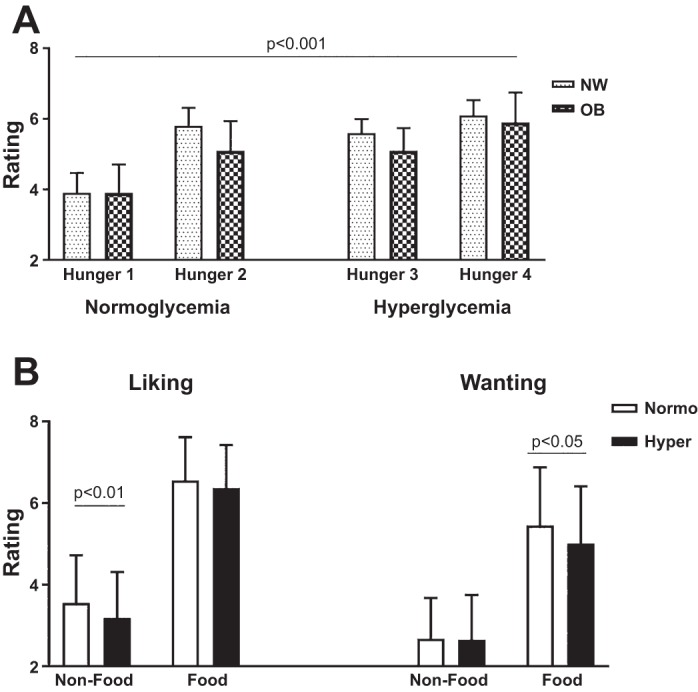
Fig. 3.

Hunger, liking, and wanting for food. Average hunger (A) and liking and wanting ratings (B) while viewing nonfood and food (high-calorie and low-calorie food) pictures during normoglycemia (Normo) and hyperglycemia (Hyper) for both groups [normal weight (NW) and obese (OB)] combined (n = 20). Data are means (SD). Statistically significant P values (P < 0.05) comparing normoglycemia and hyperglycemia are indicated.
