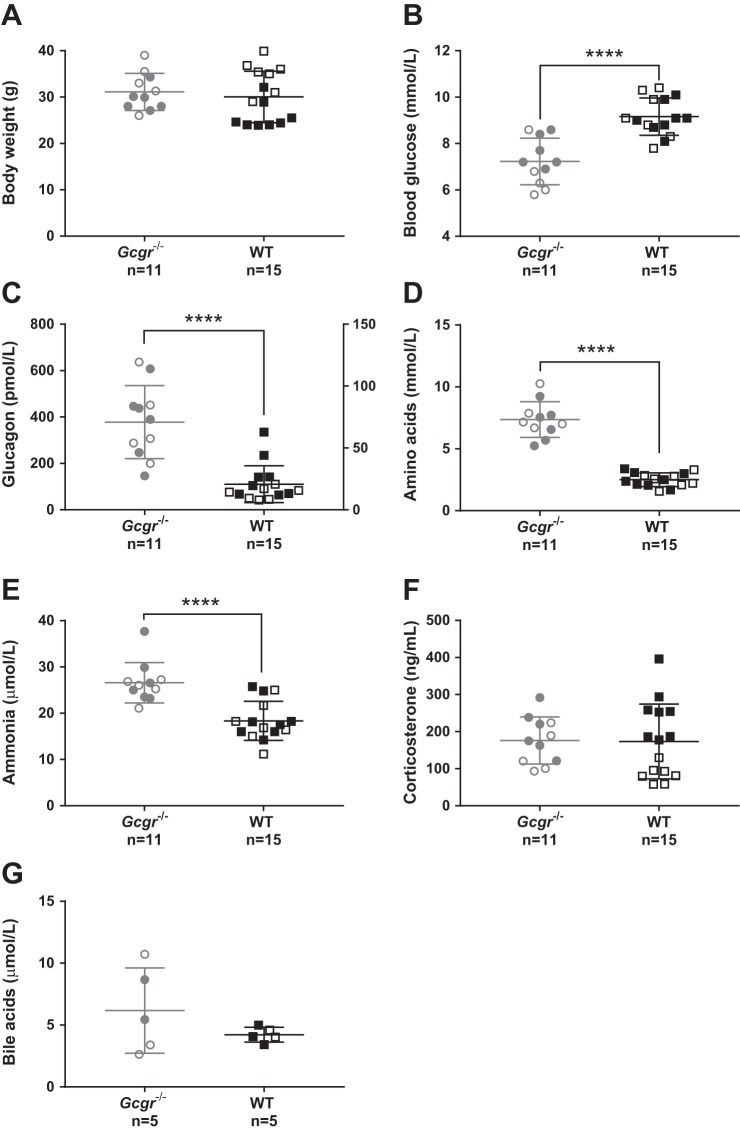
Fig. 1.
Biochemical characterization of glucagon receptor knockout mice and wild-type littermates. A: the body weight of glucagon receptor knockout (Gcgr−/−) male (gray empty circles) or female mice (gray full circles) did not differ significantly, P = 0.4, from wild-type (WT) male mice (black empty squares) or female littermates (black full squares). The body weight of female Gcgr−/− did not differ from Gcgr−/− males (P = 0.2). The body weight of female WT differed from WT males (25 ± 3 vs. 33 ± 5 g, P = 0.0002). B: blood glucose concentrations in Gcgr−/− mice were significantly lower compared with WT, P < 0.0001, and did not differ between males and females. C: plasma concentrations of glucagon were significantly increased in Gcgr−/− mice compared with WT, P < 0.0001, and did not differ between males and females. D: plasma amino acid concentrations were significantly increased in Gcgr−/− mice compared with WT, P < 0.0001, and did not differ between males and females. E: plasma ammonia/ammonium concentrations were significantly increased in Gcgr−/− mice compared with WT, P = 0.0002, and did not differ between males and females. F: plasma concentrations of corticosterone did not differ between Gcgr−/− mice and WT, P = 0.8. Plasma corticosterone concentrations of Gcgr−/− females did not differ from Gcgr−/− males, P = 0.2. Plasma corticosterone concentrations of WT females differed from WT males (251 ± 72 vs. 85 ± 25 ng/ml, P < 0.0001). G: plasma concentrations of bile acids did not differ between Gcgr−/− mice and WT, P = 0.3, and did not differ between males and females. Gcgr−/− mice, n = 11 (15–28 wk of age); WT littermates, n = 15 (15–25 wk of age). Data are presented as means ± SD. ****P < 0.0001.

