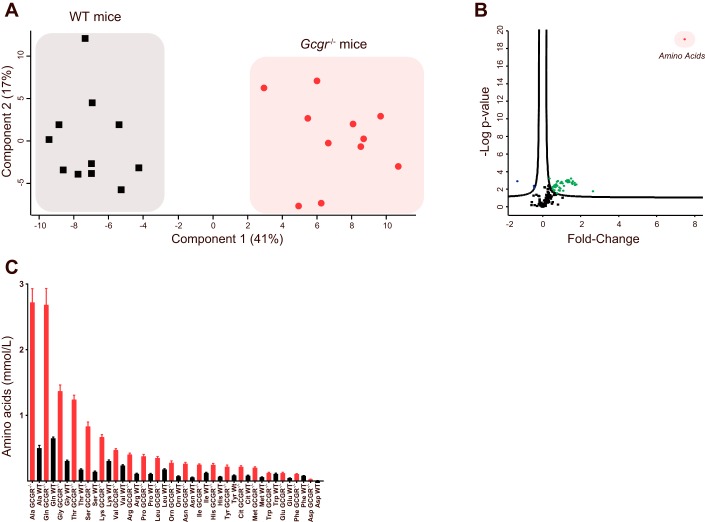
Fig. 2.
Glucagon receptor knockout mice show hyperaminoacidemia. A: a principal component analysis revealed that plasma amino acid concentrations (component 1) separated glucagon receptor knockout mice (Gcgr−/−) and wild-type (WT) littermates completely. B: a principal component analysis revealed that amino acids (red dot) were the principal component showing the greatest difference when Gcgr−/− mice were compared with WT littermates. Green dots indicate the metabolites that were significantly increased in Gcgr−/− compared with WT littermates, and blue dots indicate metabolites that were significantly decreased in Gcgr−/− compared with WT littermates. C: in Gcgr−/−, mice the concentrations of certain amino acids were elevated to a larger degree than those of other amino acids. All amino acid concentrations, except the concentration of tryptophan (Trp), were significantly higher in Gcgr−/− mice (red bars) compared with WT littermates (black bars). Data are presented as means ± SE Gcgr−/− mice, n = 11 (15–28 wk of age); WT littermates, n = 11 (18–25 wk of age).

