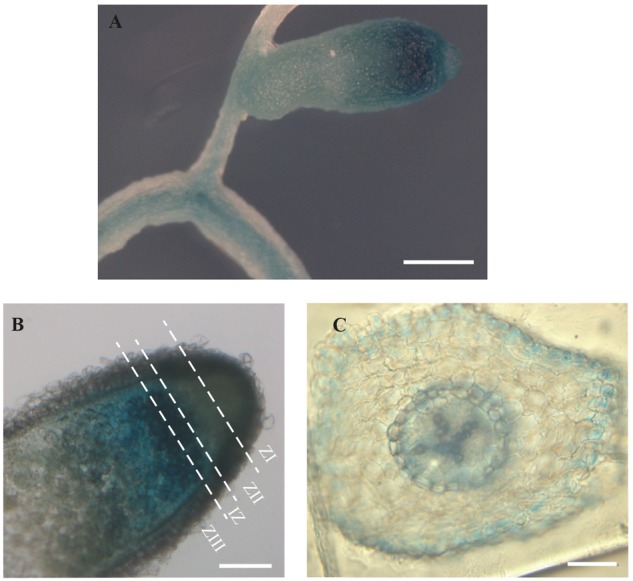
FIGURE 3.

Organ and tissue expression localization of MtMTP2. (A) GUS expression assay in roots and nodules of plants transformed with pGWB3 containing the pMtMTP2::GUS construct. Bar: 1 μm. (B) GUS expression assay in a longitudinal section of a nodule transformed with pGWB3 containing pMtMTP2::GUS construct. Bar: 100 mm. (C) Cross section of a M. truncatula root transformed with the plasmid pGWB3 containing the pMtMTP2::GUS construct. Bar: 50 μm.
