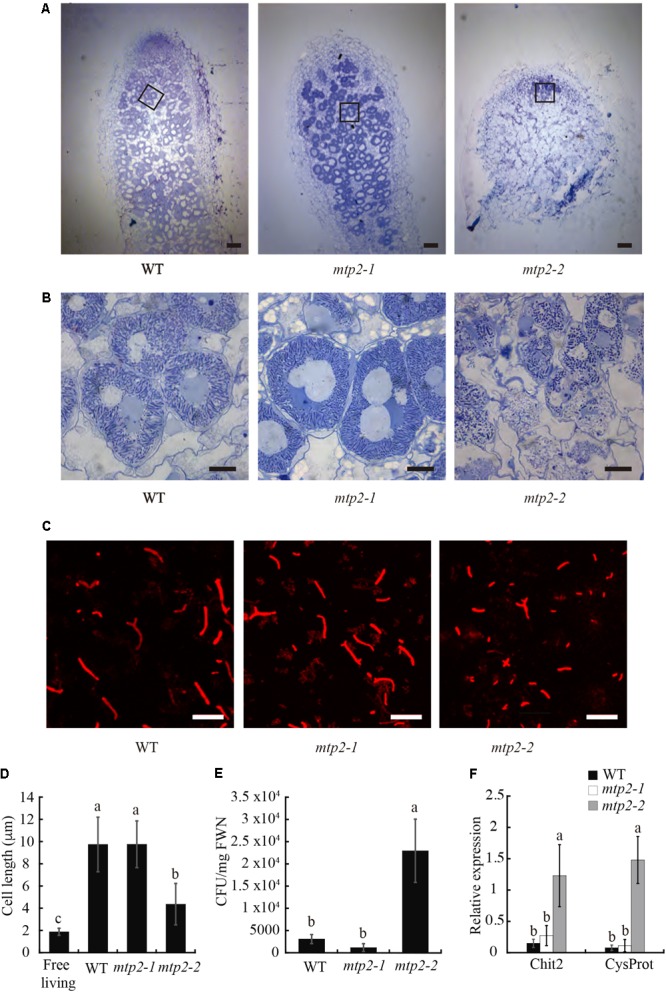
FIGURE 7.

Nodule and bacteroid development in MtMTP2 mutants. (A) Longitudinal sections of M. truncatula WT, mtp2-1, and mtp2-2 nodules stained with toluidine blue and visualized by light microscopy. Bars: 100 μm. (B) Detail of infected nodule cells of M. truncatula WT, mtp2-1, and mtp2-2 nodules stained with toluidine blue and visualized by light microscopy. Bars: 10 μm. (C) Confocal image of S. meliloti stained with propidium iodide from 28-dpi M. truncatula WT, mtp2-1, and mtp2-2 nodules. (D) Cell length of S. meliloti bacteroids isolated from WT, mtp2-1, and mtp2-2 nodules. Data are the mean ± SD of at least 100 cells. (E) S. meliloti CFU per mg fresh weight of 28-dpi nodules from WT, mtp2-1, and mtp2-2 plants. Data are the mean of three independent experiments ± SE. Values with different letters are significantly different (Tukey’s HSD, p < 0.05). (F) Expression of the senescence marker genes Chit2 (chitinase Medtr5g022560) and CysProt (cysteine protease Medtr6g079630) in 28 dpi M. truncatula nodules of WT, mtp2-1, and mtp2-2 plants relative to the internal standard gene Ubiquitin carboxyl-terminal hydrolase. Data are the mean of three independent experiments ± SE. Values with different letters are significantly different (Tukey’s HSD, p < 0.05).
