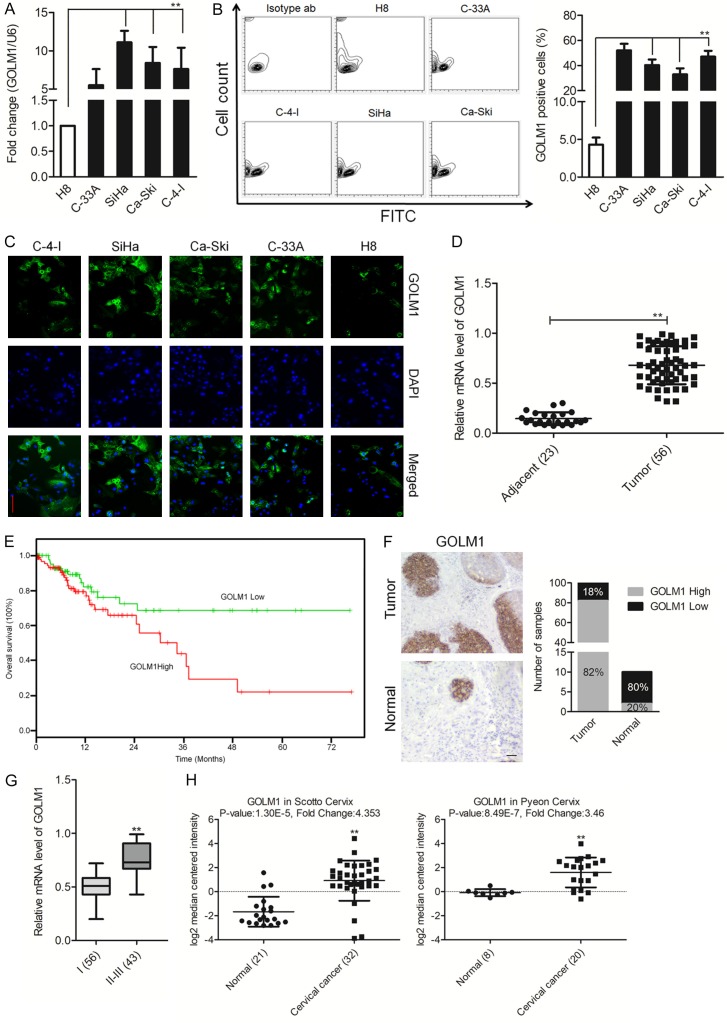
Figure 1.
Over-expression of GOLM1 in cervical cancer tissues and cell lines. A. qRT-PCR analysis of GOLM1 expression in H8 and cervical cancer cell lines. The fold changes of relative expression of GOLM1 versus that of H8 are represented in the vertical axis. Experiments were performed three times. B. Representative FACS dot plots of cells stained with anti-GOLM1 antibody (right) or with an isotype matched antibody (as a background control). Histograms reporting the percentage of GOLM1 cells as assessed by FACS. Mean ± SD of three independent experiments. **P < 0.01, compared with H8 cells. C. Cervical cancer cell lines were fixed and incubated with primary antibodies against GOLM1 and followed immunostained with anti-rabbit FITC-conjugated secondary antibody and then stained with DAPI. The specimens were visualized and photographed using a fluorescence microscope (Scale bar represents 100 μm). Blue depicts the nucleus and green depicts GOLM1. D. Comparison of GOLM1 abundance in 56 paired tumor and adjacent non-tumor tissues. The relative expression of GOLM1 normalized to the internal control GAPDH is shown. **P < 0.01, compared with normal. E. Kaplan-Meier analysis of overall survival of patients with cervical cancer stratified by the expression of GOLM1. F. Immunohistochemical staining of GOLM1 in cervical cancer tissues. G. The level of GOLM1 in different stages was determined by semi-quantitative analyses of IHC staining. **P < 0.01, compared with I. H. Box plots show decreased levels of GOLM1 in cervical cancer tissues compared with normal tissues in two microarray data sets. **P < 0.01, compared with normal tissues.

