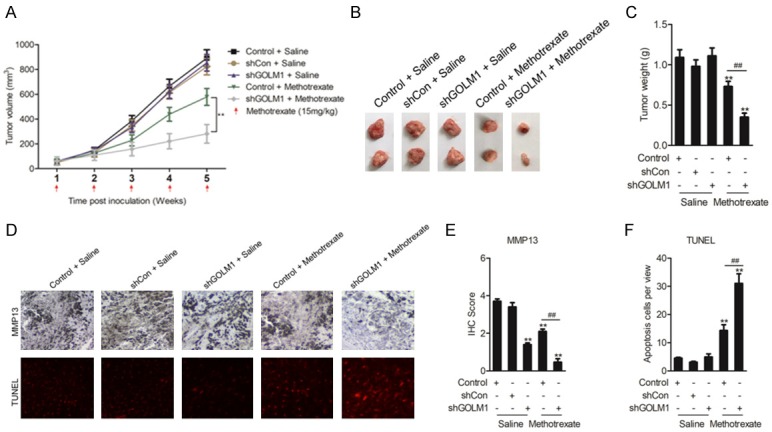
Figure 6.

GOLM1 modulates the methotrexate sensitivity of cervical cancer cells in vivo. A. Tumor growth curves of SiHa cells transfected with shCon or shGOLM1 and treated with methotrexate or saline. B. Representative images showing the tumors formed in the five groups, including Control + saline, shCon + saline, shGOLM1 + saline, Control + Methotrexate and shGOLM1 + Methotrexate at the 5th week after subcutaneous transplantation or when mice were killed. C. Comparison of the mean tumor weights of the five groups. D. Representative IHC images for MMP13 or TUNEL staining among the five tumor xenografts groups. E, F. Statistical comparisons of MMP13 expression and apoptotic cell numbers among the five tumor xenografts groups. **P < 0.01, compared with Control + saline, ##P < 0.01, compared with Control + Methotrexate.
