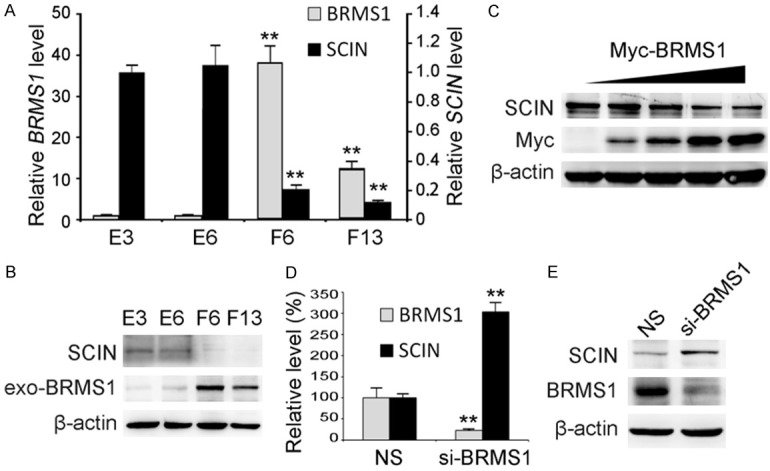
Figure 1.

The expression level of SCIN was suppressed by BRMS1. (A) Relative BRMS1 and SCIN mRNA levels in SK-Hep1 cell clones stably expressing exogenous BRMS1 (F6 and F13) and control cell clones (E3 and E6) were analyzed through qRT-PCR. Values were normalized to internal control 18S rRNA and expressed as mean ± SD, n = 3. (B) The protein levels of exogenous BRMS1 (exo-BRMS1) and endogenous SCIN in SK-Hep1 cell clones were investigated through western blot. β-actin was used as a loading control. (C) Myc-tagged BRMS1 (Myc-BRMS1) and endogenous SCIN protein levels in QGY-7701 cells transiently expressing different dosages of Myc-BRMS1 were investigated through western blot. Relative longer exposure of endogenous SCIN is shown. Endogenous BRMS1 and SCIN expression levels in Huh-7 cells infected with lentivirus expressing siRNA targeting BRMS1 (siBRMS1) or non-silencing control siRNA (NS) were analyzed through qRT-PCR (D) and western blot (E).
