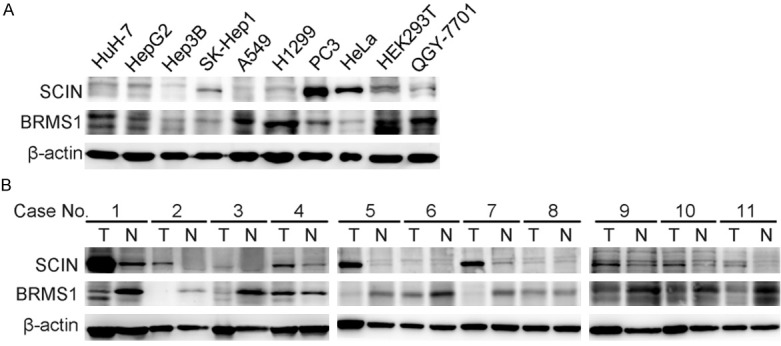
Figure 2.

The protein level of SCIN was inversely correlated with BRMS1 level in HCC cells and tissues. A. Western blot analysis of BRMS1 and SCIN levels in HEK293T, five HCC cell lines (Huh-7, HepG2, Hep3B, SK-Hep1, QGY-7701), two lung carcinoma cell lines (A549, H1299), one prostate cancer cell line (PC3) and one cervical carcinoma cell line (HeLa). B. Western blot analysis of BRMS1 and SCIN levels in 11 paired HCC specimens. T, tumor tissues; N, corresponding non-tumorous tissues.
