Figure 6.

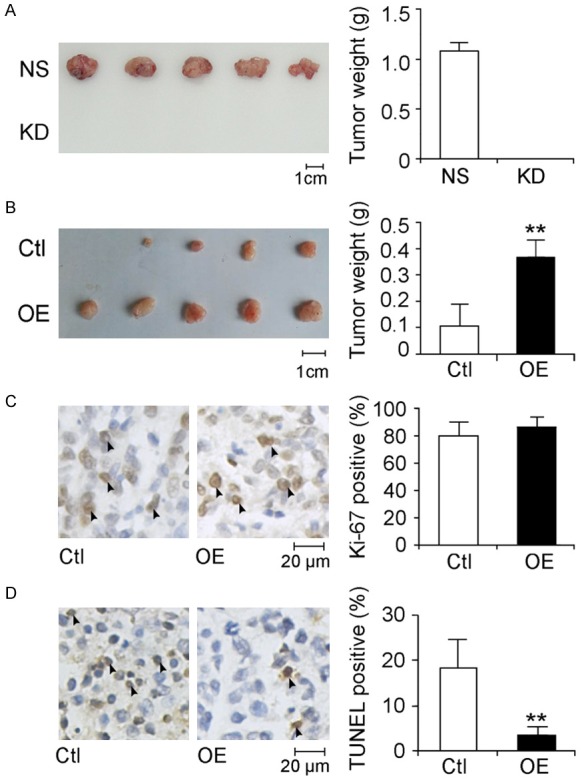
Evaluation of the function of SCIN on HCC cell growth in vivo. Photographs (left panels) and tumor weight measurements (right panels) of tumors dissected from nude mice engrafted with lentivirus-infected QGY-7701 cells (A) and SMMC-7721 cells (B). Scale bars, 1 cm. Values are indicated as mean ± SD, n = 5. (C) Immunohistochemistry staining against Ki-67 was performed in tumor tissues derived from lentivirus-infected SMMC-7721. Representative images of tumor sections are given in the left panel and typical Ki-67-positive cells are indicated with arrowheads. Scale bar, 20 μm. Ki-67 positive cell populations were statistically analyzed in the right panel. Values are indicated as mean ± SD, n = 8. (D) TUNEL assays were performed on tumor sections. Representative images of tumor sections are given in the left panel, and typical apoptotic cells are indicated with arrowheads. Scale bar, 20 μm. Apoptotic cell populations are statistically analyzed in the right panel. Values are indicated as mean ± SD, n = 8.
