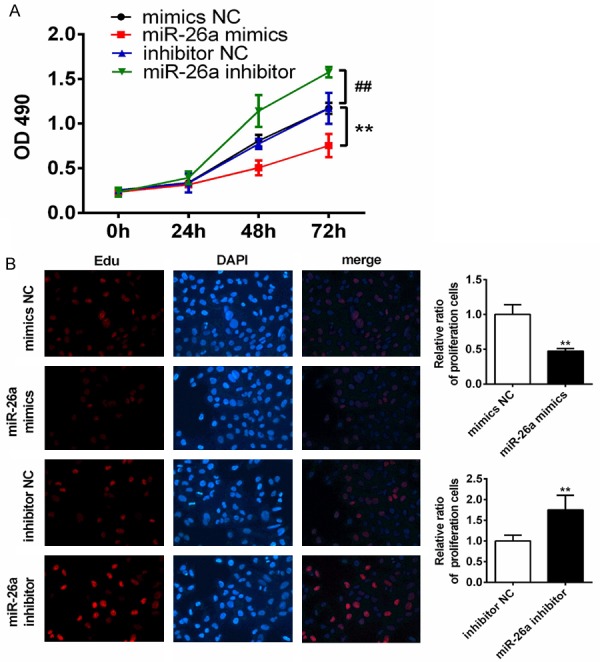
Figure 2.

miR-26a inhibited TPC-1 cell proliferation in vitro. A. Growth curves of each group were obtained by CCK-8 assay in TPC-1 cells transfected with mimics of miR-26a or mimics-NC, inhibitor of miR-26a or inhibitor-NC. OD490 was measured at 0, 24, 48 and 72 hours. B. IT click-iT EdU cell proliferation assay was performed to evaluate the number of dividing cells in TPC-1 transfected with mimics of miR-26a or mimics-NC, inhibitor of miR-26a or inhibitor-NC. Representative immunofluorescent images were shown and average number of EdU labeled cells, which indicated dividing cells were counted. (magnification, ×200). **, P<0.01 compared with mimics NC; ##, P<0.01 compared with inhibitor NC.
