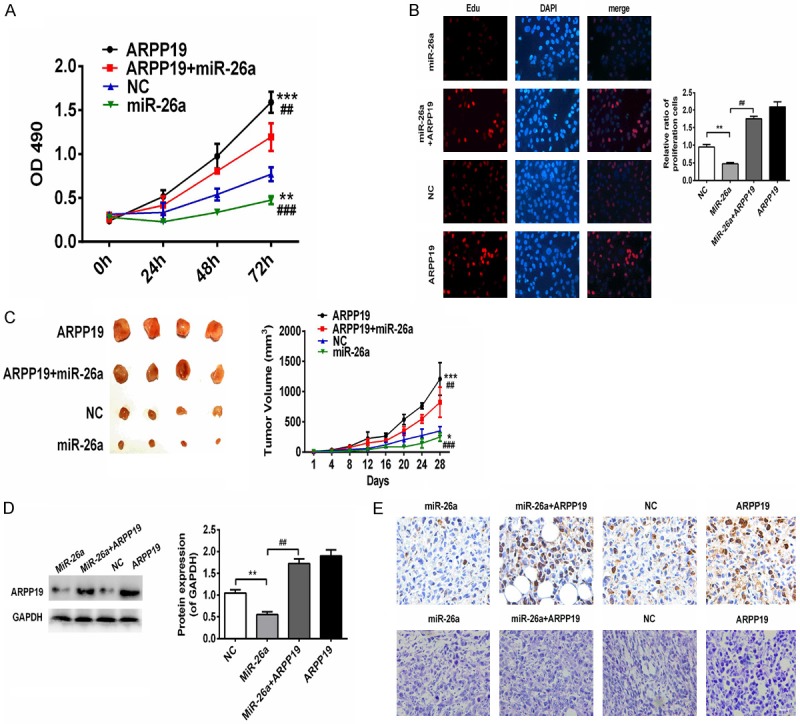
Figure 5.

Up-regulation of ARPP1 reversed the inhibitory effects of miR-26a on TPC-1 cells. A. Growth curves were obtained by CCK-8 assay in the cells transfected with miR-26a, ARPP19 alone or co-transfected and NC. OD490 was measured at 0, 24, 48 and 72 hours. **, P<0.01; ***, P<0.001 compared with NC; ##, P<0.01, ###, P<0.001 compared with ARPP19+miR-26a group. B. IT click-iT EdU cell proliferation assay was performed to evaluate the number of dividing cells in TPC-1 transfected with miR-26a, ARPP19 alone or co-transfected and NC. Representative immunofluorescent images were shown and average number of EdU labeled cells which indicated dividing cells were counted (magnification, ×200). **, P<0.01 compared with NC; ##, P<0.01 compared with miR-26a. C. Representative images of tumor xenografts and tumor growth curves were shown. *, P<0.05; ***, P<0.0001, compared with NC; ##, p<0.01, ###, p<0.001 compared with ARPP19+miR-26a group. D. Protein levels of ARPP19 in each group were determined by western blot. **, P<0.01 compared with NC; ##, P<0.01 compared with miR-26a. E. Representative images of HE staining (top) and ki67 immunohistochemically staining (bottom) were shown (magnification, ×200).
