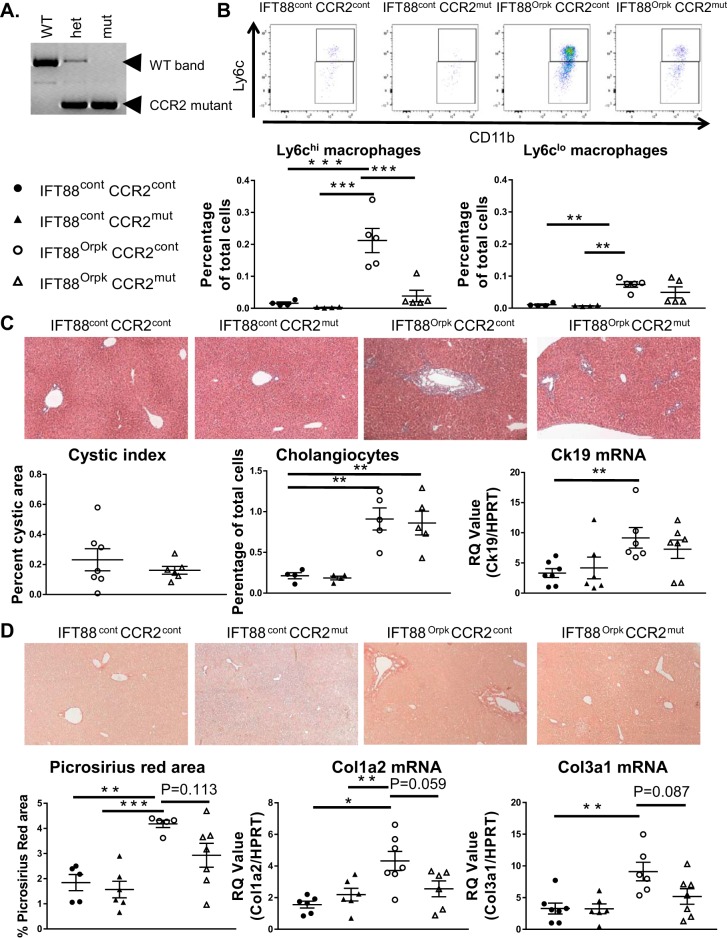
Fig. 8.
Ly6chi macrophages and fibrosis are reduced in IFT88Orpk FVB CCR2−/− mice. A: PCR analysis of DNA extracted from wild-type (WT), heterozygous (het), and knockout (mut) mice for the CCR2 gene. B: representative fluorescence-activated cell sorting plots of infiltrating macrophage subtypes harvested from control (cont) and IFT88Orpk (mut) mice on control (cont) or CCR−/− (mut) background at 4 wk of age with quantification of Ly6chi and Ly6clo macrophages from their respective groups (n = 4–5). C: representative histological images of liver sections from 4-wk-old mice (n = 6–8). Cystic index was quantified for IFT88Orpk CCR2 control and IFT88Orpk CCR2−/− mice. Cholangiocyte number was quantified using flow cytometry [(cytokeratin 19 (Ck19)-positive cells] and quantitative RT-PCR for Ck19. D: representative picrosirius red-stained sections from 4-wk-old mice (n = 6–8) with quantification of picrosirius red-positive area and quantitative RT-PCR data for collagen types 1 and 3 (Col1a2 and Col3a1). Values are means ± SE. *P < 0.05; **P < 0.01; ***P < 0.001.

