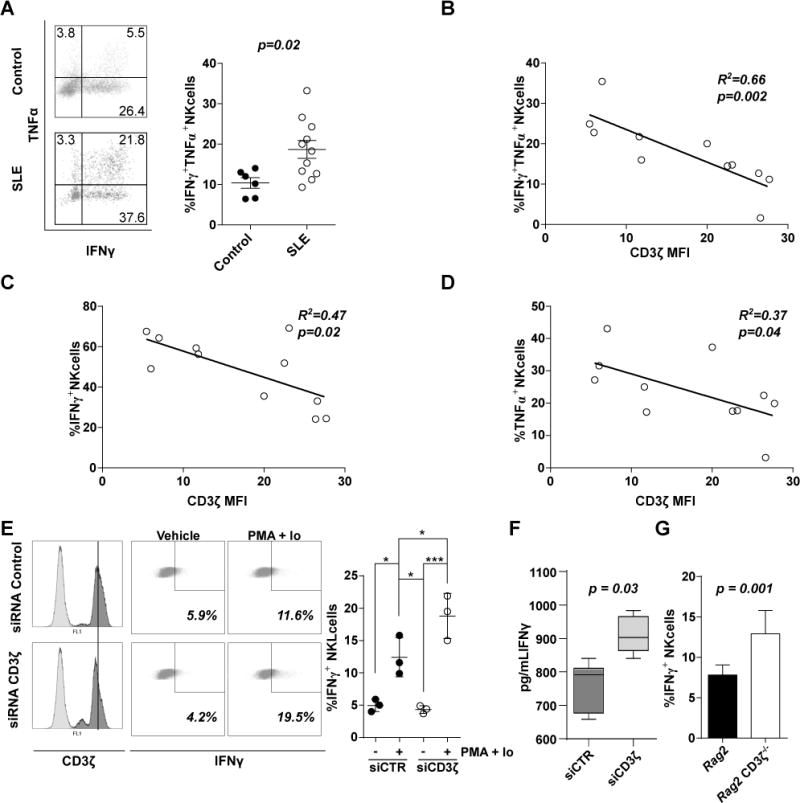
Figure 5. Downregulation of CD3ζ leads to a proinflammatory phenotype in NK cells from SLE patients.

(A, left) Representative dot plot showing percentage of NK cells from healthy donors (Control, upper) or SLE patients (SLE, lower) producing IFNγ, TNFα or both. (A, right) Scatter diagram of cumulative values of IFNγ+TNFα+ NK cells from healthy donors and SLE patients. Correlations between (B) IFNγ+TNFα+, (C) IFNγ+, and (D) TNFα+ with CD3ζ values in NK cells from SLE patients are shown. (E) Representative histograms of CD3ζ basal levels (E, left) and % of IFNγ+ (E center) in siRNA control (upper) or CD3ζ (lower) treated NKL cells are shown. (E, right) Scatter diagram showing cumulative data of % of IFNγ+ NKL cells under different conditions as indicated in the graph (n=3 independent experiments). (F) IFNγ was also measured in supernatants from NKL cells electroporated with CD3ζ siRNA or control siRNA using an ELISA kit, values are represented with a box and whiskers graph. (G) Column bar graph representing the mean ± SEM of % of IFNγ+ NK cells from Rag2 knockout or Rag2 knockout CD3ζ−/− mice from two experiments with at least three mice per experiment. Differences in (A), (F) and (G) were evaluated by unpaired T-test. Pearson’s correlation analysis was conducted to determine the relationship in (B), (C) and (D). A One-way ANOVA was performed to detect differences in (E; * = p < 0.05, ** = p < 0.001, *** = p < 0.0001).
