
Figure 6. Downregulation of CD3ζ alters early NK cell signaling.
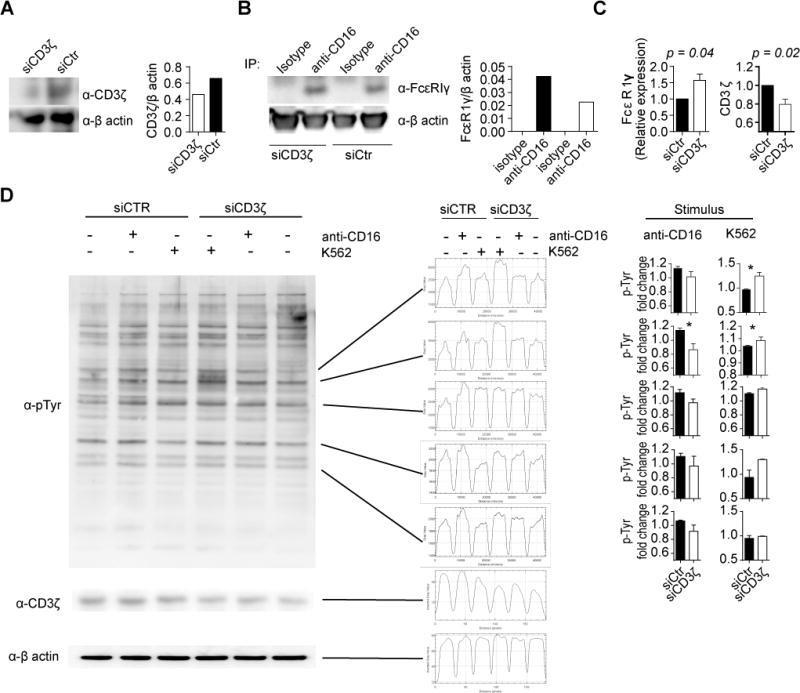
(A) NKL cells were electroporated with CD3ζ siRNA or control siRNA, and cell lysates immunoblotted for CD3ζ and β-actin. Densitometric quantitation is shown in the graph (right panel). (B) CD16 was immunoprecipitated from lysates from NKL cells electroporated with CD3ζ siRNA or control siRNA. Coimmunoprecipitated FcεRIγ was determined by Western blotting (representative experiment out of 3). Densitometric quantitation is shown in the graph (right panel). (C) Expression levels of FcεRIγ and CD3ζ were normalized to levels obtained from cells electroporated with control siRNA. Cumulative data from the 3 independent experiments are shown. D) NKL cells electroporated with CD3ζ siRNA or control siRNA were stimulated with a crosslinking CD16 antibody or with K562 cells for one minute. A representative Western blot (out of 3) is shown for phospho-tyrosine, CD3ζ and β-actin, and band density profile are shown on the center. Data were normalized (fold change over the unstimulated condition) and cumulative data for each quantified band are shown on the left. T test was used to evaluate differences. *p < 0.05