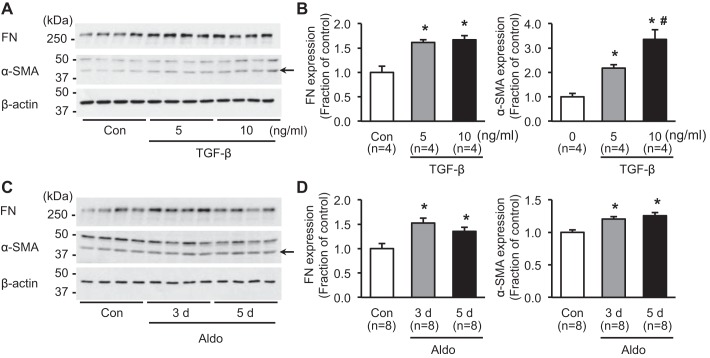
Fig. 1.
Expression of fibrosis marker proteins in response to TGF-β or aldosterone (Aldo) treatment in mpkCCDc14 cells. A and B: semiquantitative immunoblotting of fibronectin (FN; ~262 kDa) and α-smooth muscle actin (α-SMA; ~42 kDa; arrow). Densitometric analysis of samples from vehicle-treated control (Con) and TGF-β (5 or 10 ng/ml; 3 days)-treated mpkCCDc14 cells. C and D: semiquantitative immunoblotting of FN (~262 kDa) and α-SMA (~42 kDa; arrow). Densitometric analysis of samples from vehicle-treated control and aldosterone (10−6 M; 3 or 5 days)-treated mpkCCDc14 cells. n, number of cell lysate preparations. *P < 0.05 compared with control group; #P < 0.05 compared with a group of TGF-β treatment (5 ng/ml; 3 days).

