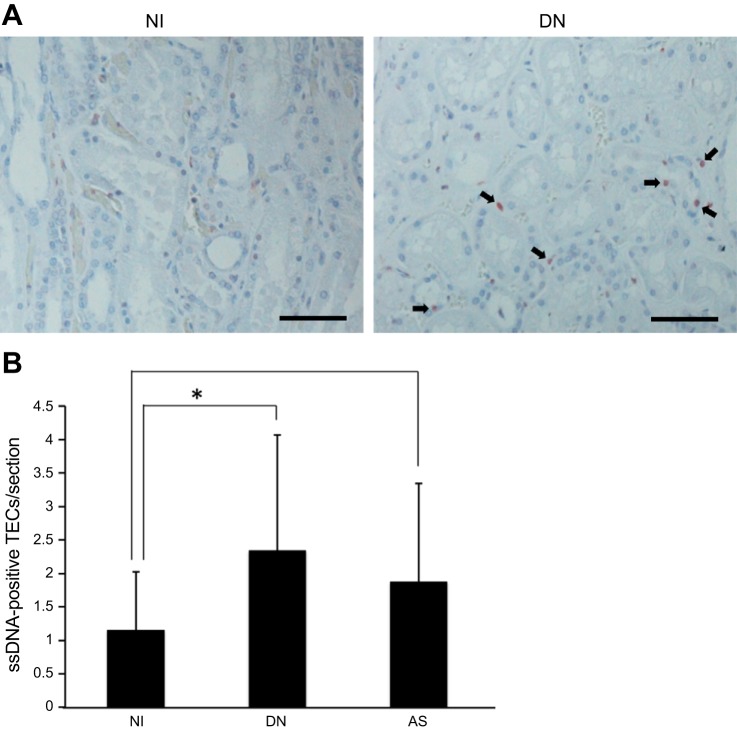
Fig. 2.
Apoptotic cells in nephropathies. A: representative images of immunohistochemical staining of ssDNA against NI and DN kidney. The sections were counterstained with hematoxylin. The arrows indicate ssDNA-positive TECs. Scale bar = 100 μm. B: the numbers of apoptotic cells among human renal tubular cells per section (×400). Values are means ± SD. NI, n = 13; DN, n = 9; AS, n = 8. *P < 0.05.

