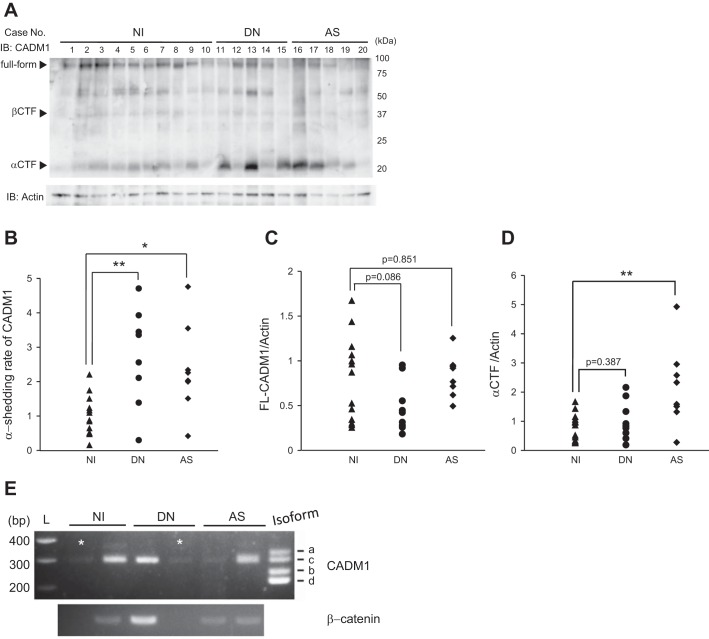
Fig. 3.
Western blot analysis of CADM1 in nephropathies. A: Western blot analysis using anti-COOH-terminal-CADM1 antibody. Arrowheads indicate bands corresponding to the FL, β-CTF, and α-CTF forms of CADM1. B: CADM1 ectodomain shedding rates (amount of α-CTFs relative to FL-CADM1). *P < 0.05. **P < 0.01. C and D: FL- and α-CTF-CADM1 levels, respectively, relative to β-actin are plotted as dots in each patient sample. Significance between two groups was analyzed using the t-test. Values are means ± SD. NI, n = 13; DN, n = 9; AS, n = 8. P values ≤ 0.05 are shown. E: total RNAs from renal sections of human NI, AS, and DN were analyzed by RT-PCR using a primer set encompassing the CADM1 extracellular juxtamembrane region. The PCR products were electrophoresed together with CADM1 isoform (SP1–4) size markers. L, 100-base pair (bp) ladder. RNAs were also PCR-amplified using a primer set for β-actin to indicate RNA loading per lane. *FFPE samples that did not have the sufficient RNA quantity.

