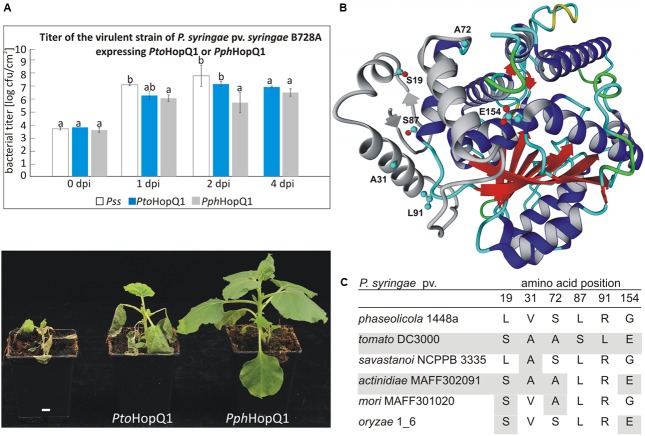
FIGURE 1.
PtoHopQ1 and PphHopQ1 differ in their avirulence properties. (A) Nicotiana benthamiana plants were dip-inoculated with Pseudomonas syringae pv. syringae B728A expressing either one of the effectors. Bacterial titers were determined at 0/1/2/4 days post inoculation (upper panel). Note that due to severe tissue collapse of Pss infected leaves, the collection of samples was not possible at 4 dpi. Lower panel shows the plants 7 days after inoculation. The experiment was performed three times with similar results. Data were analyzed using repeated measures analysis of variance (ANOVA), followed by Tukey HSD post hoc test performed for each time point separately. Statistically distinct groups are marked with different letters above each column. (B) Representative model of PtoHopQ1 generated by I-TASSER (Zhang, 2008; Roy et al., 2010) and visualized using Yasara View (Krieger and Vriend, 2014). The flexible N-terminal part of the protein, which varies in particular models, is shown in gray. The residues that differ in PtoHopQ1 compared to PphHopQ1 are denoted in ball and stick representation. (C) Comparison of HopQ1 variants from the selected strains.

