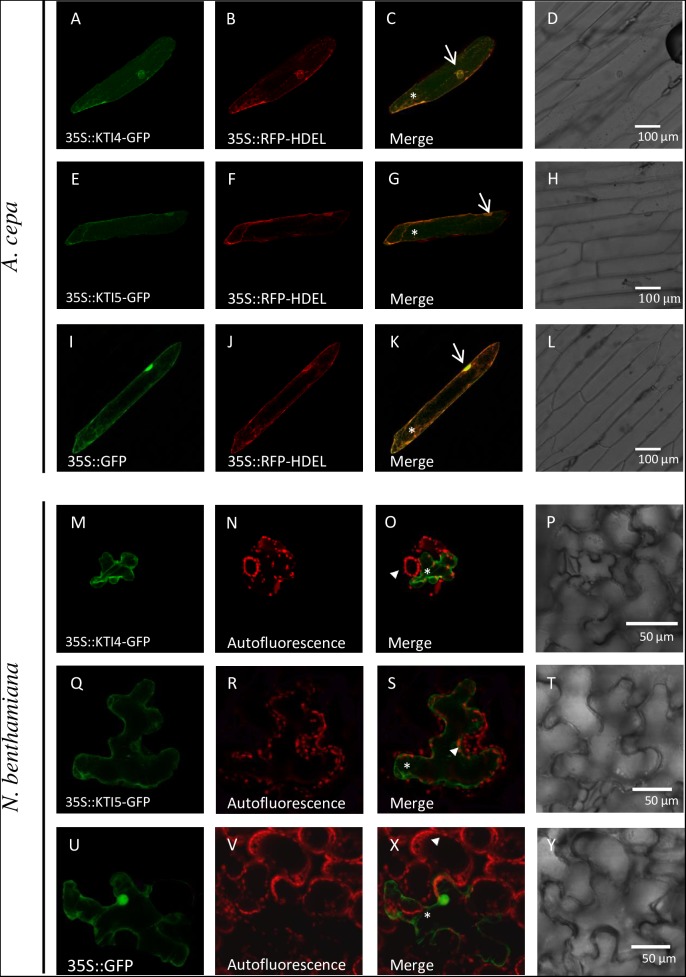
FIGURE 3.
AtKTI4 and AtKTI5 subcellular localization. Confocal stacks spanning epidermal onion cells co-transformed with 35S::KTI4-GFP, 35S::KTI5-GFP and 35S::GFP and 35S::RFP-HDELcontrols. Confocal images and projections of the KTI4 (A) and KTI5 (E) are shown. Projections from GFP (A,E,I), RFP (B,F,J), merged (C,G,K) and the corresponding Nomarski snapshots (D,H,L). Confocal stacks spanning N. benthamiana cells agroinfiltrated with 35S::KTI4-GFP (M), 35S::KTI5-GFP (Q) and 35S::GFP control (U). Projections from GFP (M,Q,U), chlorophyll auto fluorescence (N,R,V), merged (O,S,X) and the corresponding Nomarski snapshots (P,T,Y). Bars are indicated in images. Arrows indicate nuclei, asterisks signal ER and arrowheads the chlorophyll autofluorescence.

