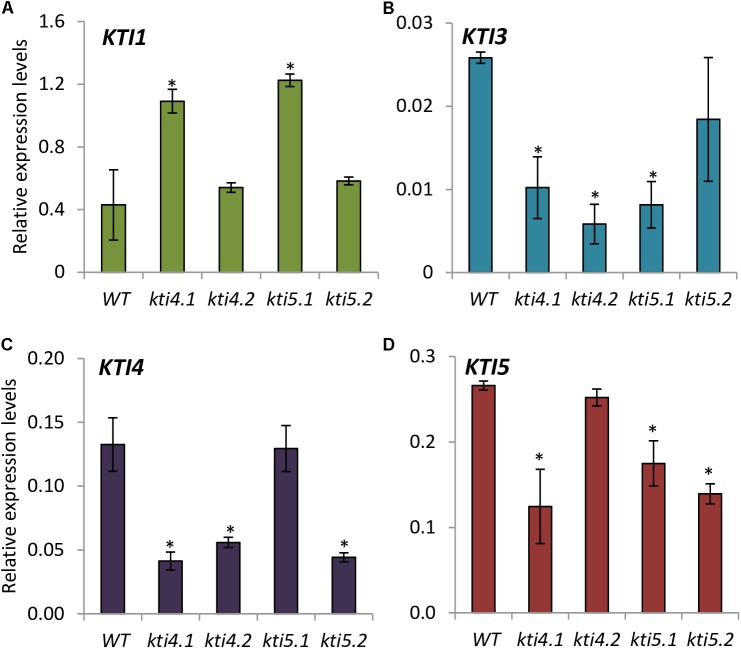
FIGURE 4.
Gene expression of Kunitz-type inhibitors in Arabidopsis T-DNA insertion lines and WT plants. Relative gene expression levels of: (A) AtKTI1 (B) AtKTI3 (C) AtKTI4 and (D) AtKTI5. Data are means ± SE of three replicates. Asterisk indicates significant differences with the WT (P < 0.05, One-way ANOVA followed by Dunnett’s test).

