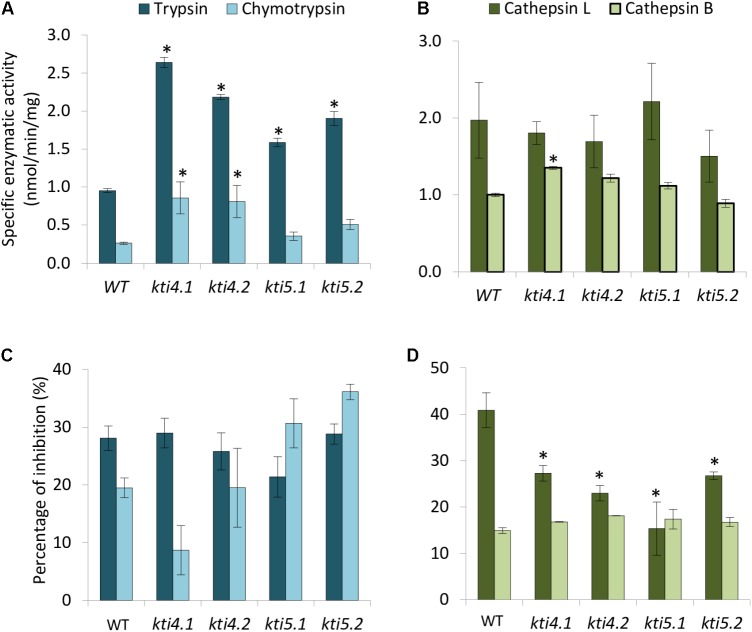
FIGURE 5.
Proteolytic patterns of T-DNA insertion lines. Specific proteolytic activities of protein extracts from Arabidopsis T-DNA insertion lines and control WT using specific substrates. (A) Trypsin- and chymotrypsin-like specific activities. (B) Cathepsin L- and B-like specific activities. Data are expressed as nmoles/min/mg. Inhibitory activity of protein extracts from T-DNA insertion lines and control plants against commercial proteases. (C) Inhibitory activity against trypsin and chymotrypsin. (D) Inhibitory activity against commercial papain (cathepsin L-like) and bovine cathepsin B. Data are expressed as a percentage of inhibition. Data are means ± SE of three replicates. Asterisk indicates significant differences with the WT (P < 0.05, One-way ANOVA followed by Dunnett’s test).

