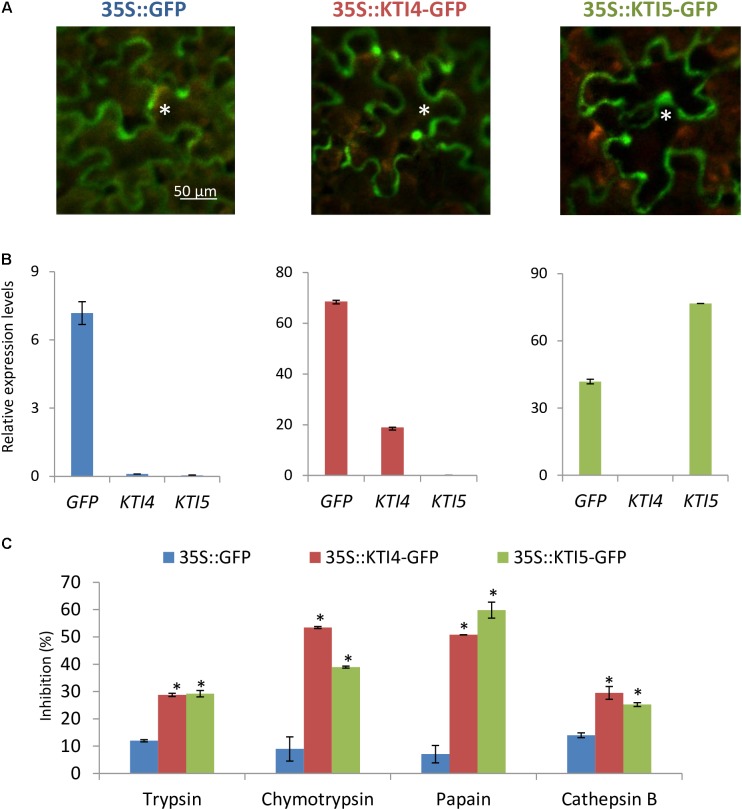
FIGURE 6.
Characterization of the expression, location and inhibitory properties of AtKTI4 and AtKTI5 genes by using transient expression assays in N. benthamiana plants. (A) GFP signal after 3 days of agroinfiltration. Asterisks indicate GFP signal of the epidermal cells. (B) Relative expression levels of GFP, KTI4, and KTI5 genes in the N. benthamiana plants after 3 days of infiltration. (C) Inhibitory ability of N. benthamiana protein extracts expressing KTI4 and KTI5 genes against commercial trypsin, chymotrypsin, papain and bovine cathepsin B 3 days post-agroinfiltration. Data are mean ± SE of triplicate measurements of each sample. Asterisk indicates significant differences with the 35S::GFP plants (P < 0.05, One-way ANOVA followed by Dunnett’s test).

