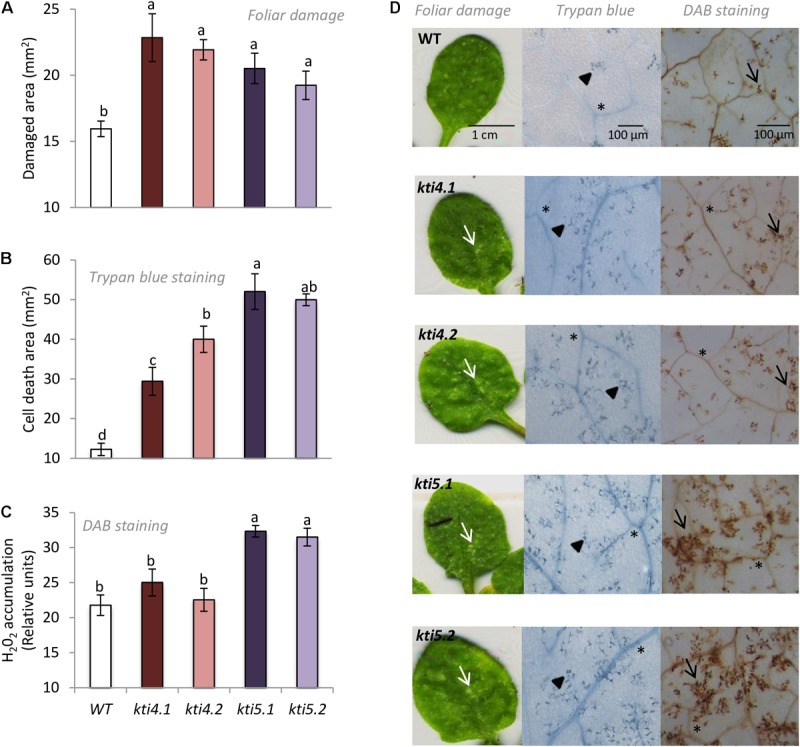
FIGURE 7.

Plant damage and hydrogen peroxide production of Arabidopsis genotypes infested with T. urticae. (A) Foliar area damaged on Arabidopsis T-DNA insertion lines (kti4.1, kti4.2, kti5.1, kti5.2) and WT plants after 4 days of spider mite infestation. (B) Trypan blue stained area on leaf disks from Arabidopsis T-DNA insertion lines and WT plants after 1 day of spider mite infestation. (C) Hydrogen peroxide production on leaf disks from Arabidopsis T-DNA insertion lines and WT plants after 1 day of spider mite infestation. (D) Example of leaf phenotypes of Col-0 genotypes after spider mite infestation. Data are means ± SE of six replicates. Different letters indicate significant differences (P < 0.05, One-way ANOVA followed by Student–Newman–Keuls test). Bars are as indicated in images. White arrows indicate plant damage, arrowheads cell death, black arrows H2O2 accumulation and asterisks signal indicate vascular tissues.
