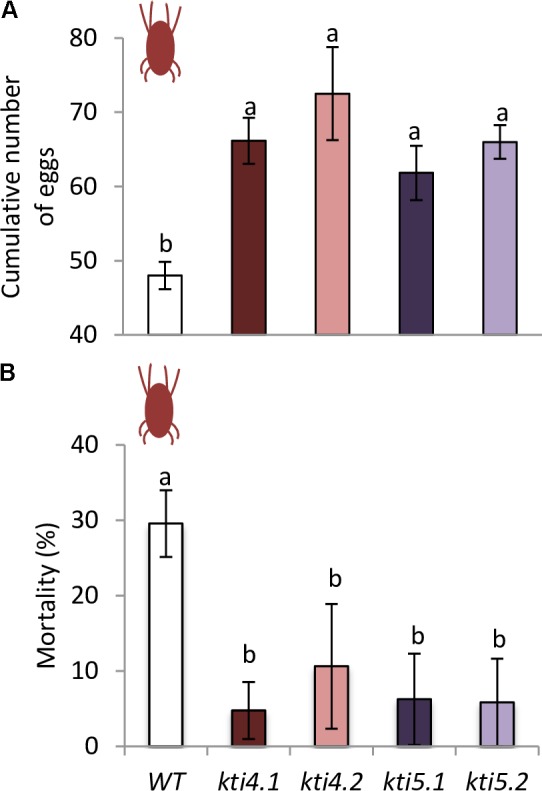
FIGURE 8.

Analysis of spider mite performance. (A) Effects of T-DNA insertion lines and control plants on T. urticae fecundity, 36 h after infestation with synchronized females. (B) Effects of T-DNA insertion lines and control plants on T. urticae mortality, 10 days after infestation with neonate larvae. Data are means ± SE of eight replicates. Different letters indicate significant differences (P < 0.05, One-way ANOVA followed by Student–Newman–Keuls test).
