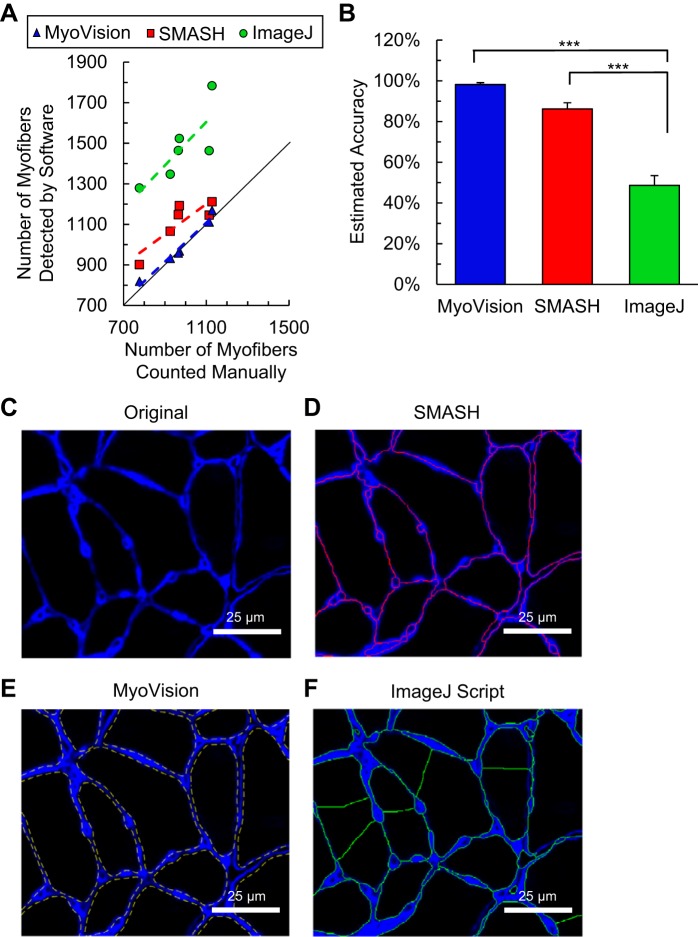
Fig. 4.
Fiber detection and counting. A: comparison of MyoVision (blue), SMASH (red), and ImageJ plug-in (green) with manual fiber counting for six mouse plantaris muscles. MyoVision counts lie directly on the line of identity (black). Markers above the line of identity represent over-segmentation. B: estimated accuracy of each method is expressed as percent difference from manual counts (*** denotes P < 0.001). C–F: representative images of the segmentation for each algorithm compared with the original laminin-labeled (blue) image. Significant oversegmentation (a single fiber is broken up into multiple fibers) can be readily observed for the ImageJ plug-in. Scale bar = 25 μm.

