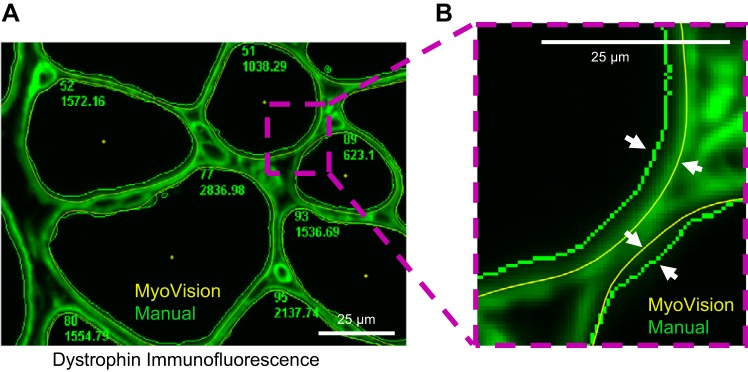
Fig. 5.
MyoVision versus semimanual outlines. A: MyoVision (yellow) and manual (green) cell outlines for the same dystrophin-labeled image. B: zoomed-in view of the region from A boxed in purple dotted line. White arrows highlight the difference between the MyoVision and the manual outlines. MyoVision outlines are closer to the dystrophin staining, therefore producing fiber CAS measurements that are consistently larger than the manual measurements (Fig. 6A). Scale bar = 25 μm.

