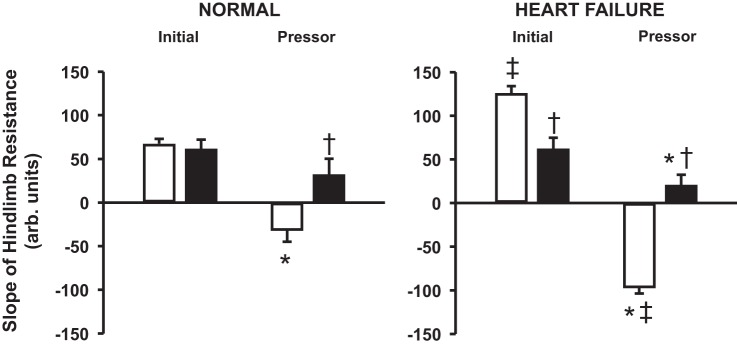
Fig. 4.
Average initial and pressor slope values of hindlimb resistance (n = 6) during control (open bars) and α1-adrenergic blockade (filled bars) experiments in normal animals (left) and after induction of heart failure (right). *P < 0.05 vs. initial slope. †P < 0.05 vs. control. ‡P < 0.05 vs. normal.

