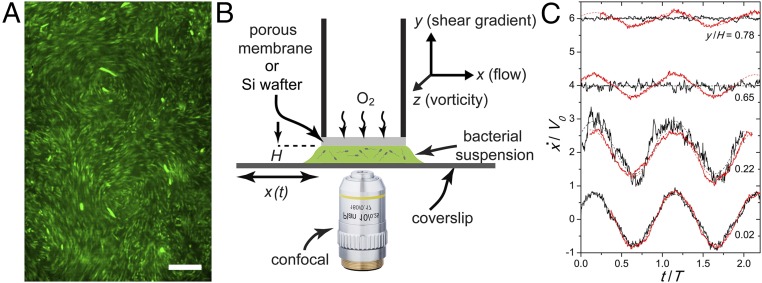
Fig. 1.
Bacterial suspensions under planar oscillatory shear. (A) Bacterial swarming at a concentration . (Scale bar, 20 m.) The fluorescently tagged serve as tracer particles for particle imaging velocimetry (PIV). (B) Schematic showing our custom shear cell. A Cartesian coordinate system is defined, where , , and are the flow, shear gradient, and vorticity directions, respectively. (C) Temporal variation of mean suspension velocities at different heights, , above the bottom plate. Red curves are for shear-rate amplitude s−1. Black curves are for s−1. Velocities are normalized by the imposed velocity amplitudes, . Time is normalized by shear period . is normalized by gap thickness . at different are shifted vertically for clarity. Dashed lines are sinusoidal fits.

