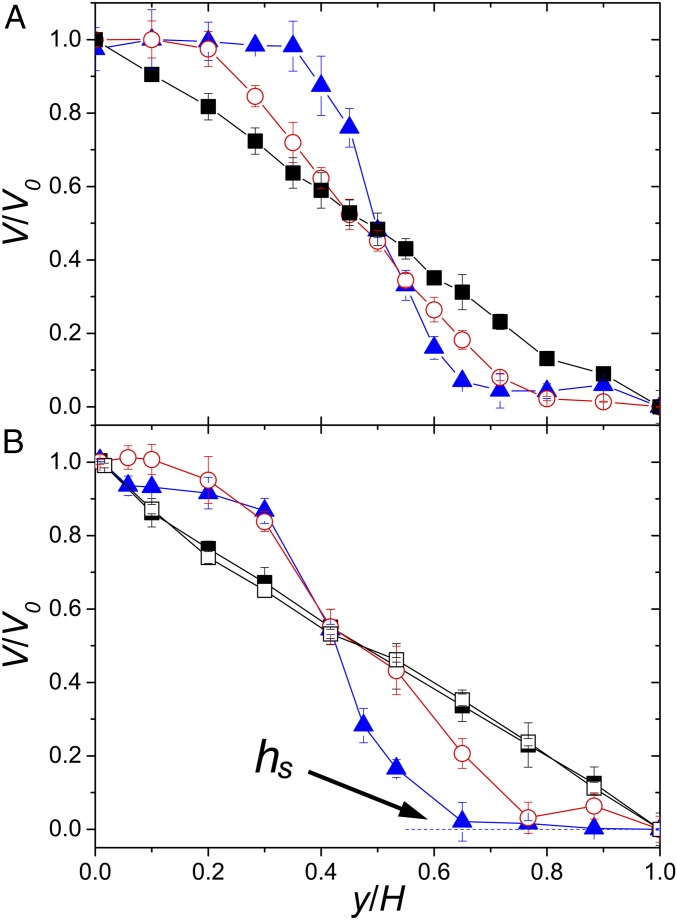
Fig. 2.
Shear profiles of bacterial suspensions. (A) Normalized shear profiles at different shear rates. is the applied shear velocity amplitude. Bacterial concentration is fixed at . The shear-rate amplitude s−1 (black squares), 0.16 s−1 (red circles), and 0.055 s−1 (blue triangles). A Si wafer is used as the top plate. (B) Normalized shear profiles at different bacterial concentrations. is fixed at 0.16 s−1. (black squares), (red circles), and (blue triangles). To maintain bacterial motility at high , a porous membrane is used as the top plate. The stop height, , of the profile at is indicated. Open squares are for a suspension of immobile bacteria at .

