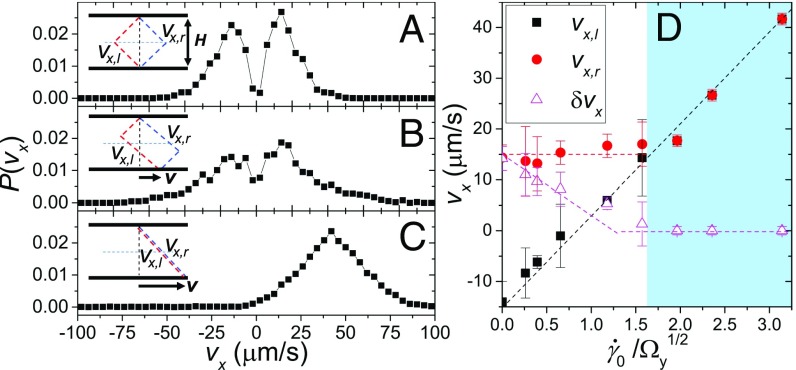
Fig. 5.
Probability distribution function of local velocities along the flow direction, , at different shear rates, . (A–C) (A), (B), and (C). Local velocities are measured when the average shear velocity reaches maximal in each shear cycle. PIV box size is chosen at , where is the characteristic radius of swarming vortices. and m. A–C, Insets show schematically the corresponding shear profiles. The thick dashed lines (red and blue) indicate the two shear configurations. The thin horizontal dashed line indicates the position of our imaging plane. The intersections give two discrete velocities, and , corresponding to the two peaks of . (D) The two peaks of , (black squares) and (red circles), and velocity variance, (magenta triangles), as a function of shear rate, . Dashed lines show the model predictions.

