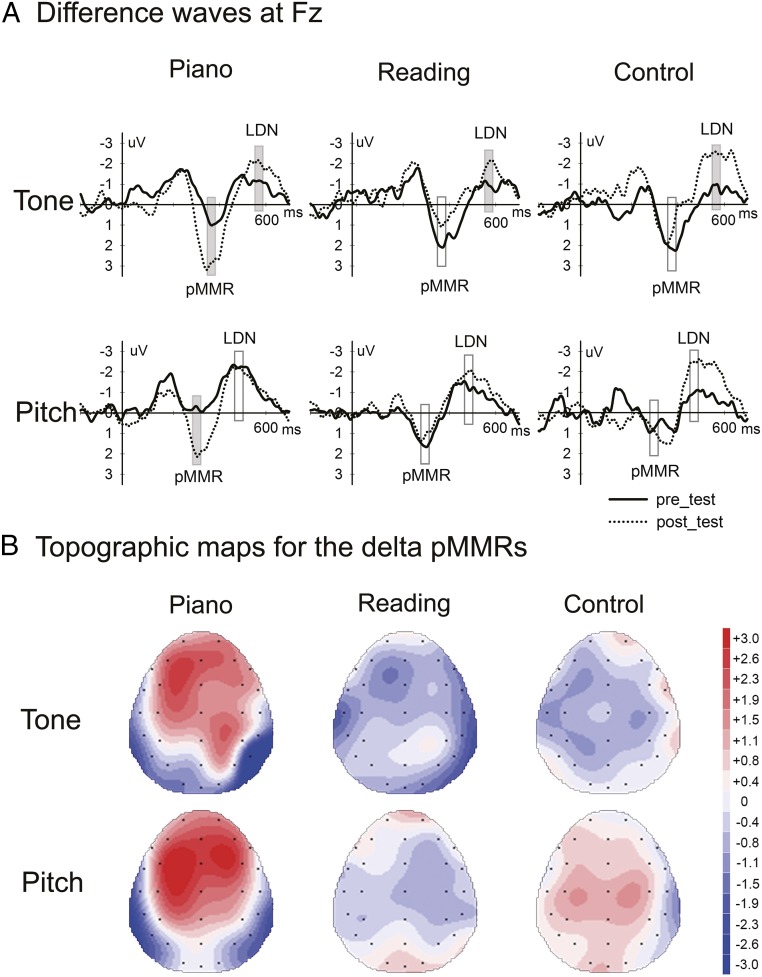
Fig. 3.
Difference waveforms at Fz and the topographic maps for the delta pMMRs among the three groups. (A) Difference waveforms for lexical tone (Upper) and musical pitch (Lower) conditions between the standard and deviant responses (deviant minus standard) for the pretest (solid line) and posttest (dotted line) sessions at Fz for the three groups. The piano group showed significantly enhanced pMMRs at posttest relative to pretest for both lexical tone and musical pitch conditions, whereas the reading and control groups did not have such effects. All three groups demonstrated significantly enlarged LDNs for lexical tone changes (for detailed results of the LDN components, as well as the related discussion, please see SI Appendix). No such effects were observed in the musical pitch condition. The 40-ms analysis windows for the peaks of pMMR and LDN are marked by open and gray rectangles. The gray rectangles indicate significant session effects. (B) The topographic maps demonstrate the scalp distributions of the delta pMMR amplitudes (post minus pre) across the lexical tone (Upper) and musical pitch (Lower) conditions in the three groups. The time window is 40 ms. As indicated by the key in the figure, hotter (darker red) areas indicate greater positivity, and cooler (darker blue) areas indicate greater negativity. For both the lexical tone and musical pitch conditions, the topographical maps of the piano group are much hotter than those of the reading and control groups, converging with the unique training effects in the piano group as indexed by the significantly enhanced pMMRs at posttest relative to pretest.

