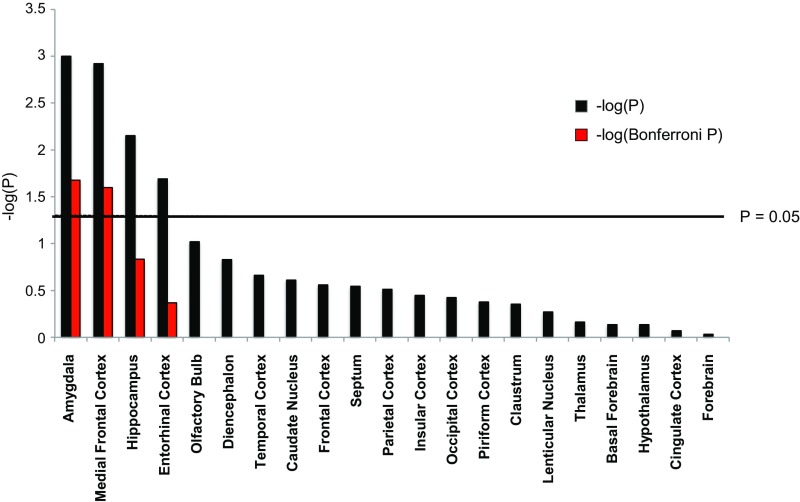
Fig. 2.
Summary of volumetric analysis of ROIs in wild and domestic rabbits. The black bars represent significance levels based on 5,000 permutations for each ROI, and the red bars represent Bonferroni-corrected P values taking the total number of independent statistical tests into account. Here results are merged over hemispheres; the results for the left and right hemispheres are given separately in SI Appendix, Fig. S2.

